Document Type : Original Article
Authors
- Yenni Darvina 1
- Desnita Desnita 1
- Rahadian Zainul 2
- Imtiaz Ali Laghari 3
- Azril Azril 4
- Mohammad Abdullah 5
1 Department of Physics, Faculty of Mathematics and Natural Sciences, Universitas Negeri Padang, Indonesia
2 Department of Chemistry, Faculty of Mathematics and Natural Sciences, Universitas Negeri Padang, Indonesia
3 Department of Electrical Engineering, Quaid-e-Awam University of Engineering, Science and Technology, Campus Larkana, Sindh, 67480, Pakistan
4 Department of Biomedical Engineering, National Cheng Kung University, Tainan City, Taiwan
5 Chemical Engineering Studies, College of Engineering, Universiti Teknologi MARA Johor Branch, Pasir Gudang Campus, Bandar Seri Alam, 81750 Masai, Pasir Gudang, Johor Bahru, Johor, Malaysia
Abstract
In this study, the synthesis of Fe3O4 /PANI nanocomposites is achieved by employing a spin coating technique, which involves the initial preparation of Fe2O3 from iron sand through magnetic separation and ball milling. The Fe3O4 precursor is then combined with polyaniline (PANI) at different concentrations (30%, 40%, 50%, 60%, and 70%) using a sol-gel process. The resulting Fe3O4 /PANI gel mixture is spin-coated onto glass substrates and dried. The nanocomposite films undergo extensive characterization through X-ray Diffraction (XRD), Scanning Electron Microscopy (SEM), Vibration Sample Magnetometry (VSM), and electrical measurements using an LCR meter. Our findings show a correlation between Fe3O4 concentrations and crystal size, observed as a decrease from 30% to 40%, an increase at 50%, and a subsequent decrease from 60% to 70%. Fourier-transform infrared spectroscopy (FTIR) confirms the chemical bonding between Fe3O4 Fe2O3 and PANI. SEM images reveal the layer thickness varies with concentration, measured as 5.02 µm, 16.54 µm, 17.82 µm, 19.36 µm, and 24.4 µm, respectively. Electrical properties indicate resistance values of 7.36 mΩ, 8.388 mΩ, 8.101 mΩ, 8.53 mΩ, and 3.53 mΩ for the respective Fe3O4 concentrations, with corresponding capacitance values. This study elucidates the structural and electrical properties of Fe3O4 /PANI nanocomposites, highlighting their potential for diverse applications.
Graphical Abstract
)
Keywords
- Fe3O4/PANI Nanocomposites Magnetic Nanomaterials Sol
- Gel Process Spin Coating Method Structural and Electrical Characterization
Main Subjects
Introduction
The integration of electronic devices into daily life has escalated energy demands, underscoring the critical need for sustainable energy sources and advancements in energy storage technologies. Among various solutions, lithium batteries stand out for their pivotal role in powering electronics, benefiting from attributes like high energy density and the absence of a memory effect, facilitating their widespread adoption [1-9]. Despite their advantages, lithium batteries grapple with significant safety, economic, and environmental concerns, necessitating the exploration of safer and more sustainable alternatives [10-17]. Addressing the limitations of conventional lithium battery materials, such as graphite, which suffers from electrochemical constraints that impede lithium ion mobility and diminish energy efficiency, research has shifted towards innovative materials. Fe3O4 magnetite nanoparticles have gained prominence as a superior alternative due to their high theoretical capacity (1000 mAh/g), abundance, and cost-effectiveness, offering a potential breakthrough in electrode material technology [18-25]. The employment of nanostructured materials is a strategic response to these challenges, aiming to enhance electrochemical performance by optimizing ion and electron transport pathways and expanding electrode contact surfaces, thus facilitating improved charge/discharge kinetics and elevated energy capacities [26-31]. Parallelly, the field of supercapacitors is witnessing significant interest owing to their remarkable specific capacitance, robustness, high power output, and eco-friendly characteristics. These features render supercapacitors ideal for applications in portable electronics and electric vehicles, demanding advancements in electrode materials to overcome the limitations posed by conventional options like activated carbon and transition metal oxides [32-54]. The quest for materials that blend high conductivity with structural advantages has led to the exploration of innovative composites. This manuscript presents a study focused on the development of a supercapacitor electrode material comprising a nanocomposite of Fe3O4 metal oxide and PANI conductive polymer.
This study aims to leverage the unique properties of supercapacitors and address the current gaps in energy storage solutions by enhancing the performance of supercapacitors through the introduction of Fe3O4 @conductive polymer nanocomposites. This approach is particularly innovative as it utilizes Fe3O4 synthesized from iron sands sourced from West Sumatra, offering a novel pathway to sustainable and efficient energy storage [61-62].
By targeting the advancement of electrode materials for both lithium batteries and supercapacitors, this study endeavours to contribute significantly to the field of energy storage, addressing both the challenges of current technologies and the pressing demand for sustainable energy solutions.
Materials and Methods
Iron sand from West Sumatra, Indonesia, was used to synthesize Fe3O4 nanoparticles. Analytical-grade reagents: FeCl2·6H2O, ammonium persulfate, HCl, and aniline monomer (C6H5N, 99%), were obtained from Sigma Aldrich and used as received.
Synthesis of Fe3O4 nanoparticles
The process started with the magnetic separation of iron sand to isolate magnetite-rich fractions, followed by cleaning and drying. The material underwent further magnetic separations and was then processed in a high-energy milling machine, with a ball-to-sample weight ratio of 10:1, for 30 hours to achieve a uniform Fe3O4 phase.
Synthesis of PANI/ Fe3O4 nanocomposite
Fe3O4 nanoparticles were mixed with hydrochloric acid (35% by volume) to prepare the precursor. FeCl2·6H2O was reacted with the nanoparticles in hydrochloric acid, using 2 mL of HCl per gram of magnetite. The nanocomposite was synthesized via in situ polymerization, varying Fe3O4 concentrations from 30% to 70%. Ammonium persulfate was added gradually over four hours. The product was then washed, dried, and prepared for spin coating to form thin layers, which were dried at 60 °C.
Characterization of PANI/ Fe3O4 nanocomposite
The Fe3O4 /PANI samples underwent characterization using X-ray diffraction (XRD), scanning electron microscopy (SEM), and electrical testing with an LCR meter to evaluate their crystal structure, morphology, and electrical properties.
Results and Discussion
Structure of Fe3O4/PANI nanocomposite
The structural characteristics of Fe3O4 /PANI nanocomposites with varied Fe3O4 concentrations were elucidated through X-ray diffraction (XRD) analysis. Figure 1 presents the diffraction patterns for the nanocomposites at Fe3O4 concentrations of 30%, 40%, 50%, 60%, and 70%. XRD results show variations in peak intensities and widths, reflecting differences in crystal sizes. The peaks are assigned to PANI (Powder Diffraction File code: 00-060-1168) and Fe3O4 (Powder Diffraction File code: 01-078-3149).
Incorporating the analysis from recent studies, we can enhance the understanding of the relationship between Full Width at Half Maximum (FWHM) values and crystal sizes, particularly through the lens of Scanning Electron Microscopy (SEM) images. The FWHM values, as indicators of crystal perfection and size in X-ray diffraction patterns, offer a quantitative measure of crystal dimensions. A direct correlation between FWHM values and crystal sizes has been observed, where smaller FWHM values often signify larger crystalline structures due to reduced strain and defects within the crystal lattice. This relationship is critical in materials science, especially for optimizing the properties of nanocomposites and thin films where crystal size plays a pivotal role in determining the material's electrical, optical, and mechanical properties. Studies have demonstrated that the addition of certain elements, such as Zn in CdS films, can significantly alter the structural and optical properties of the resulting compounds, affecting their bandgap and, consequently, their application potential in devices like solar cells.
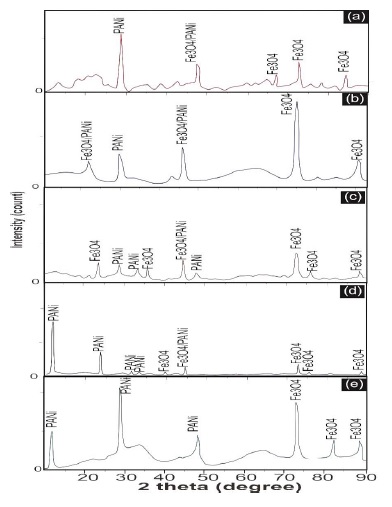
Figure 1: Diffraction patterns of Fe3O4 /PANI nanocomposite at various Fe3O4 concentrations: (a) 30%, (b) 40%, (c) 50%, (d) 60%, and (e) 70%
The alteration in crystal size and structure, as influenced by composition and processing conditions, can be meticulously analysed through SEM imaging, providing a visual and quantitative assessment of these changes [63-65]. SEM images not only complement the data obtained from FWHM measurements by offering a direct visual representation of the crystal sizes and shapes, but also help in understanding the morphological evolution of the material as a function of different synthesis conditions or compositional variations. This dual approach of combining XRD analysis with SEM imaging forms a comprehensive methodology for investigating and tailoring material properties at the nanoscale. Analysis reveals that crystal size is smaller at a 40% concentration compared to 30%, 60%, and 70% concentrations, with the largest crystal size at 50% concentration. Subsequently, crystal size diminishes at 60% and 70% concentrations. In addition, Full Width at Half Maximum (FWHM) values correlate directly with crystal sizes, where smaller FWHM values indicate larger crystals. FWHM values increase from 30% to 70% concentration, signifying a reduction in crystal size.
SEM imaging was utilized to examine the cross-sectional thickness of Fe3O4 /PANI nanocomposite layers. Figure 2 displays cross-sectional images for 30%, 40%, 50%, 60%, and 70% concentrations. The thickness increases with concentration, revealing a direct relationship between Fe3O4 concentration and nanocomposite layer thickness. Specifically, layer thicknesses are 5.02 µm, 16.54 µm, 17.82 µm, 19.36 µm, and 24.4 µm for 30%, 40%, 50%, 60%, and 70% concentrations, respectively. This trend underscores that higher Fe3O4 concentrations lead to denser layers, attributable to more Fe3O4 particles integrating into the polymer matrix [66-68]. The integration of SEM imaging in the analysis further solidifies the understanding of how changes in concentration affect the structural attributes of nanocomposites, directly correlating with FWHM findings and providing a more comprehensive picture of material behaviour across different concentrations.
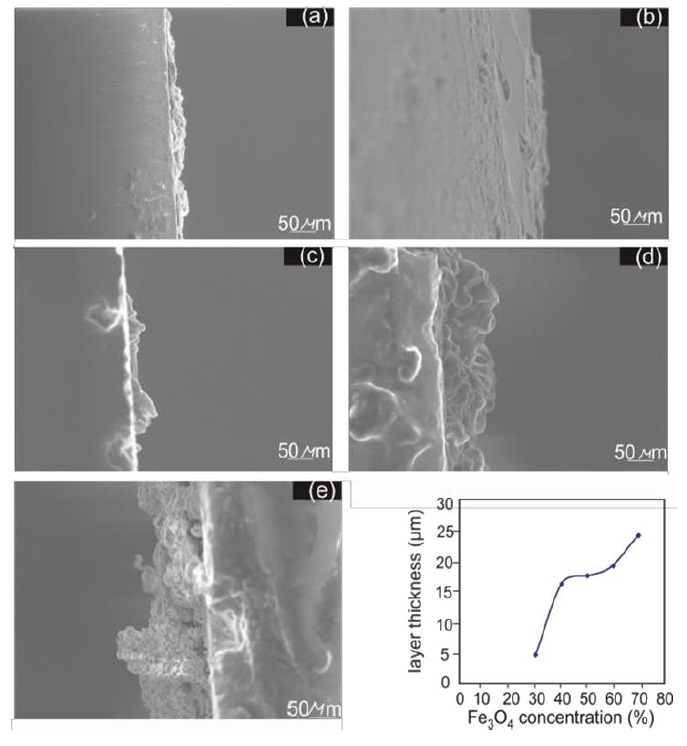
Figure 2: Cross-sectional images of Fe3O4 / PANI nanocomposite layers at varying Fe3O4 concentrations. Insets show the relationship between Fe3O4 concentration and layer thickness
Upon examining the SEM images in Figure 2, which showcase cross-sectional views of Fe2O3/PANI nanocomposite layers at different Fe3O4 concentrations, a clear trend is evident in the morphology and layer thickness as the concentration of Fe3O4 increases. The images labelled (a) through (e) correspond to increasing concentrations of Fe3O4 from 30% to 70%. Image (a) shows a relatively smooth and uniform layer, indicative of a lower concentration composite. As the concentration rises, images (b) and (c) display progressively rougher textures and increased irregularity, suggesting a densification of the nanocomposite structure with more Fe3O4 particles becoming embedded within the polymer matrix. Further increases in Fe3O4 concentration are reflected in images (d) and (e), where the layers not only become thicker, but also exhibit a more pronounced ruggedness and porosity. This is consistent with the inset graph, which plots layer thickness against Fe3O4 concentration, demonstrating a nonlinear increase in thickness. The thickest layer at the 70% concentration shows significant morphological changes, including larger, more distinct particles and a more complex surface topology compared to the smoother layers at lower concentrations. These observations support the idea that the Fe3O4 concentration within the nanocomposite has a significant impact on both the microstructural and macrostructural scales. The microstructural scale, indicated by the surface topology and particle size visible in the SEM images, suggests that higher Fe3O4 concentrations lead to greater agglomeration and potentially affect the electrical and mechanical properties of the nanocomposite. On the macrostructural scale, the overall increase in layer thickness could impact the feasibility of layer application and the performance of the nanocomposite in practical devices. The morphological features observed in these SEM images are crucial for understanding the material's performance characteristics. The rugged and porous structure observed at higher Fe3O4 concentrations could potentially enhance the surface area of the electrode, which is beneficial for applications like supercapacitors that rely on surface reactions. Conversely, the increased roughness and irregularity at higher concentrations might lead to mechanical instability, which would be a trade-off against the enhanced electrical properties. Therefore, optimizing the Fe3O4 concentration in the Fe3O4/PANI nanocomposite is essential for balancing these properties to meet specific application requirements. Overall, the SEM analysis provided in Figure 2 affords a comprehensive understanding of the material's structural evolution with changing Fe3O4 concentration, offering insights into the trade-offs and considerations necessary for the application-specific optimization of Fe3O4 /PANI nanocomposites.
The study demonstrates that Fe2O3 concentration not only affects crystal size, but also significantly impacts the thickness of the nanocomposite layers, highlighting the direct correlation between material composition and structural properties.
Electrical properties of Fe3O4/PANI nanocomposite
The study of the electrical properties of Fe3O4/PANI nanocomposite layers is crucial to this research. Electrical resistance and capacitance were precisely measured using an LCR meter. Figure 3 demonstrates the correlation between Fe3O4 concentration in the nanocomposites and their electrical resistance.
XRD results show a clear trend in resistance values at Fe3O4 concentrations of 30%, 40%, 50%, 60%, and 70%, recorded as 7.36 mΩ, 8.388 mΩ, 8.101 mΩ, 8.53 mΩ, and 3.53 mΩ, respectively. Notably, resistance decreases with an increase in Fe3O4 concentration, reaching the lowest at 70% with 3.53 mΩ.
Further examination into the electrical capacitance at the same Fe3O4 concentrations revealed capacitance values of 5.4×10⁻¹¹ F, 2.8×10⁻¹¹ F, 4.2×10⁻¹¹ F, 2.69×10⁻¹⁰ F, and 1.6×10⁻¹¹ F, respectively. Figure 4 illustrates an initial increase in capacitance with concentration, peaking at 60%, before a decline at 70%.
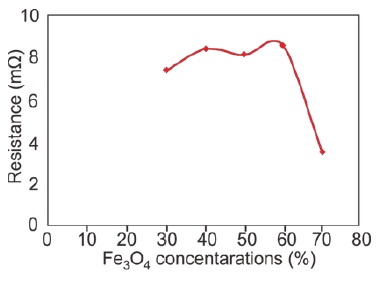
Figure 3: Graph showing the correlation between Fe3O4 concentration and electrical resistance in Fe3O4 /PANI nanocomposite layers
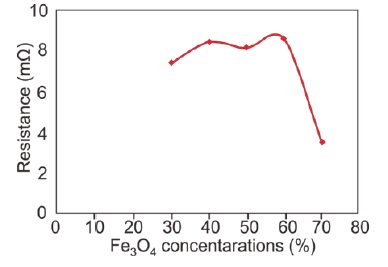
Figure 4: Graph illustrating the relationship between Fe3O4 concentration and electrical capacitance in Fe3O4 /PANI nanocomposite layers
These findings highlight the significant impact of Fe3O4 concentration on the electrical properties of the nanocomposites. The decrease in resistance with higher Fe3O4 concentration suggests improved conductivity, likely due to the greater presence of conductive Fe3O4 particles. Conversely, capacitance exhibits a complex relationship with concentration, peaking at 60% then decreasing, likely due to interactions between the dielectric properties of the PANI matrix and the conductive nature of Fe3O4 particles. These insights are pivotal for optimizing Fe3O4/ PANI nanocomposites' application in electronic devices [69-71].
Electrochemical response of Fe3O4/PANI nanocomposite
The electrochemical performance of Fe3O4 /PANI nanocomposite-based supercapacitor electrodes was assessed through Electrochemical Impedance Spectroscopy (EIS) using a CS350 EIS Potentiostat/Galvanostat (Corrtest Instruments, China) over a frequency range from 1 Hz to 30,000 Hz. The EIS measurements, set at an amplitude of 5 mV and a bias of 0 V DC in a 6 M KOH electrolyte using Ag/AgCl reference electrodes, are depicted in Figures 5 and 6.
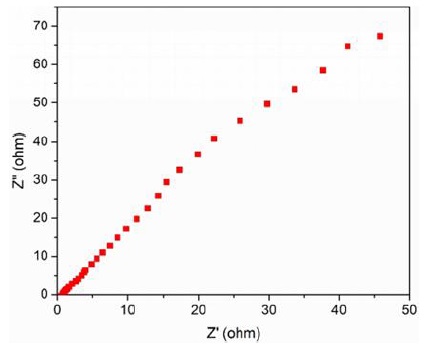
Figure 5: Nyquist plot for Fe₃O₄/PANI nanocomposite electrode with 60% Fe₃O₄ by weight
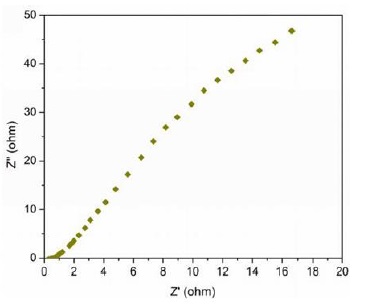
Figure 6: Nyquist plot for Fe₃O₄/PANI nanocomposite electrode with 70% Fe3O4 by weight
The Nyquist plots show characteristic impedance behaviours, with straight lines in both high and low frequency regions, indicating optimal electrochemical impedance characteristics. The equivalent series resistance (ESR) was approximately 0.8 Ω, reflecting the combined resistances of the Fe3O4 /PANI nanocomposite, the electrolyte's ionic resistance, and the contact resistance at the interface with the current collector [72].
These results illuminate the efficient electron transport within the supercapacitor, underscoring the potential of the Fe3O4/PANI nanocomposite for high-performance energy storage applications. The impedance behaviour across frequency regions also provides insights into charge transport mechanisms and electrode-electrolyte interactions, crucial for the design and optimization of Fe3O4/PANI nanocomposite-based supercapacitors [73-77].
Conclusion
The synthesis of Fe3O4 /PANI nanocomposites through sol-gel and spin-coating techniques marks a significant advancement in materials science. Characterization revealed distinct diffraction peaks for Fe3O4, PANI, and their composite, indicating successful integration. Electrophysically, these nanocomposites demonstrated a low resistance of 3.53 mΩ at a 70% Fe3O4 concentration and a peak capacitance of 2.69×10⁻¹⁰ F at 60% concentration. Such electrical properties highlight the potential of Fe3O4 /PANI nanocomposites as supercapacitor electrodes, promising for advanced energy storage applications. This research not only confirms the successful combination of Fe3O4 and PANI, but also establishes a foundation for further exploration and optimization of these materials in cutting-edge energy storage technologies.
Disclosure Statement
No potential conflict of interest was reported by the authors.
Funding
This work was supported by the Lembaga Penelitian dan Pengabdian Masyarakat Universitas Negeri Padang. The authors gratefully acknowledge the financial assistance for this research provided under contract number 238/UN35/LT/2022.
Authors' Contributions
All authors contributed to data analysis, drafting, and revising of the paper and agreed to be responsible for all the aspects of this work.
ORCID
Yenni Darvina
https://orcid.org/0009-0000-8971-5181
Desnita Desnita
https://orcid.org/0000-0002-7179-9871
Rahadian Zainul
https://orcid.org/0000-0002-3740-3597
Imtiaz Ali Laghari
https://orcid.org/0000-0001-5091-0297
Azril Azril
https://orcid.org/0000-0001-8685-5517
Mohammad Abdullah
https://orcid.org/0000-0003-1775-7926
HOW TO CITE THIS ARTICLE
Yenni Darvina, Desnita Desnita*, Rahadian Zainul, Imtiaz Ali Laghari, Azril Azril, Mohammad Abdullah, Advancements in Fe3O4/PANI Nanocomposite Film Technology: Synthesis and Characterization. J. Med. Chem. Sci., 2024, 7(5) 689-702.
OPEN ACCESS
©2024 The author(s). This article is licensed under a Creative Commons Attribution 4.0 International License, which permits use, sharing, adaptation, distribution and reproduction in any medium or format, as long as you give appropriate credit to the original author(s) and the source, provide a link to the Creative Commons license, and indicate if changes were made. The images or other third party material in this article are included in the article’s Creative Commons license, unless indicated otherwise in a credit line to the material. If material is not included in the article’s Creative Commons license and your intended use is not permitted by statutory regulation or exceeds the permitted use, you will need to obtain permission directly from the copyright holder. To view a copy of this license, visit: http://creativecommons.org/licenses/by/4.0/
PUBLISHER NOTE
Sami Publishing Company remains neutral concerning jurisdictional claims in published maps and institutional affiliations.
CURRENT PUBLISHER
Sami Publishing Company
)