Document Type : Original Article
Authors
- Syaiful Bahri 1
- Annisa Elcentia Fajarwati 1
- Andi Setiawan 1
- John Hendri 1
- Suripto Dwi Yuwono 1
- Yuli Ambarwati 1
- Rahadian Zainul 2
1 Department of Chemistry, Faculty of Mathematics and Natural Sciences, Universitas Lampung, Jalan Soemanatri Brojonegoro No.1 Bandar Lampung 35145, Lampung, Indonesia
2 Department of Chemistry, Faculty of Mathematics and Natural Sciences, Universitas Negeri Padang, Padang, West Sumatra, Indonesia
Abstract
In this study, we explore a steroid compound from the endophytic of the mangrove (Avicennia marina). Penicillium sp. is one of the microbes endophytic isolated from the mangrove and induced in the chitin medium by the so-called "cultivation". The cultivation in the medium is a strategy to enhance secondary metabolites production. In addition, the steroid compound of the secondary metabolites can be extracted and isolated from the purified fraction, followed by analysis and characterization to validate the target compound. Using the acquired 14MA15 fraction as a representative sample, we found that it presents a peak in the UV spectrum at a wavelength of 206 nm from the carbonyl group. The stretching vibration of C=O group in the IR spectrum is also confirmed at 1712 cm-1. Furthermore, other stretching vibrations from the O-H group, C-O group, and –C–H group are detected at 3410 cm-1, 1055 cm-1, and 1463 - 723 cm-1, respectively. Therefore, it is concluded that the steroid compound proposed has a molecular formula of C26H40O2 according to MS fragmentation analysis.
Graphical Abstract
)
Keywords
Main Subjects
Introduction
Bioactive compounds from mangrove endophytes have attracted significant research owing to their unique bioactivity properties [1-3]. For the first, it was investigated by Bournot in 1913, in India and West Africa, secondary metabolites have been explored from mangrove wood (Avicennia tomentose) [4-6]. To date, bioactive compounds have been isolated from the leaves, roots, bark, and twigs of the genus Avicennia, such as terpenoids, steroids, naphthalene derivatives, flavonoids, glycosides [7-10], saponins, polyphenols, alkaloids, and tannins [11, 12]. As such, they have been applied for a wide variety of utilization, such as antioxidants [13], anticancer [14], antibacterial [15-17], biopesticides [18-20], and so on. However, they exhibit some disadvantages due to utilize part of mangrove plant, including low yield, the long time needed, high solvent consuming, and complex procedures [21-23]. Therefore, other techniques, such as the cultivation of endophytic microbes associated with mangroves, are medium-based approaches through the inosculated microbes to perform and improve secondary metabolites [24-26]. Avicennia marina (A. marina) belongs to the mangrove family of Avicenniaceae [27-29]. On the other hand, A. marina has been investigated to have Aspergillus sp. and Penicillium sp. as dominant endophytic, followed by Alternaria sp., Exserohilum sp., Eurotium sp., Rhizopus sp., and Mucor sp. as other endophytic [30-32]. In recent years, several phytochemicals from endophytes of Avicennia marina have been explored and observed to be identified their bioactivity [33-35]. For instance, Meng et al. [36] reported brocazine derivatives, and epicorazine has been isolated from the strain of Penicillium brocae MA-231 of A. marina, that inoculated using PDA medium. However, such a PDA medium requires high substrates (e.g., glucose, peptone, yeast extract, and naturally sourced and filtered seawater with specification pH 6.5-7.0). Moreover, the inoculated process to grow mycelia of microbes is necessary long time until 30 days and complex procedures. Recently, chitin mediums have been successfully fabricated by extracting the shrimp shell via deproteinization, and demineralization to obtain purified chitin colloid. Although this method is necessary long time to process step-by-step, however, the method is an inovative strategy to utilize shrimp shell waste to produce a chitin medium to grow the mycelia of microbes through the mixing of inorganic salts (e.g., NH4NO3, K2HPO4, FeSO4.7H2O, MgSO4.7H2O, lactose, and distillate water). Therefore, a chitin medium is the potential to be used as the alternative medium to inoculate and grow microbes with easy application, and relatively large yield [37-39]. Herein, we report a steroid compound isolated from the endophytic of the mangrove (A. marina). To obtain secondary metabolites, the endophytic, which is the Penicillium sp., is inoculated via a chitin medium so-called "cultivation".
In addition, the isolation of the secondary metabolites is carried out to acquire purified fractions. Furthermore, the fraction as a pure compound is selected to be analyzed and characterized. Finally, we have evaluated the pure compound using UV-Vis, GC-MS, and FTIR to elucidate the structure of the steroid compound, and validate the compound as antibacterial againts Staphylococcus aureus and Pseudomonas aeruginosa.
Materials and Methods
Cerium sulfate reagent (Ce(SO4)2), dragendorff reagent, ninhydrin reagent, distillate water (H2O), methanol (MeOH), MeOH PA, n-Hexane, n-ButOH were purchased from Merck Reagent. Colloidal chitin, agar, shrimp shell powder, alcohol 70 %, DC Kieselgel 60 W TLC silica gel plate, silica gel, sephadex LH-20, sterile artificial seawater, Staphylococcus aureus and Pseudomonas aeruginosa bacteria, Trypthic Soy Broth (TSB), plastic wrap, methylene blue, resazurin, antibiotics (ciprofloxacin and chloramphenicol) were used from preparation to characterization.
Biomaterial preparation
The selection of mangrove trees (A. marina) to be used as samples were conducted by direct observation. Samples were taken randomly at several points in the mangrove area in the Pesawaran area to represent the diversity of endophytes in the mangroves. Determination of the coordinates of each sample location used an Android-based Global Positioning System (GPS). The samples were taken are 6 mangrove roots, 3 mangrove stems, and 3 mangrove leaves that were not infected with microbial and there were no insect bite. The mangrove parts were pre-sterilized used 70% alcohol and put in a ziplock so that the sample were not contaminated, and then the sample were put into a cool box and brought to the laboratory for isolation steps [40].
Chitin selective medium production
The preparation of chitin medium is carried out by referring to [37] with several modifications.
Shrimp shell sample preparation
Shrimp shell and head waste shrimp that have been collected cleaned and dried in the sun to obtain dry shrimp shells which will be used as the main ingredient for making chitin.
Colloidal chitin production
In the deproteination steps, the crushed shrimp shell powder were put into a beaker, added with 5% NaOH solution in a ratio of 1:10 (w / v), and then stirred for 2 hours at 65 °C. The solution was filtered through filter paper, and a precipitate was obtained. The precipitate was washed with distilled water until the pH became neutral, and then dried in an oven at 65 °C for 24 hours. In the demineralization steps, the deproteinized chitin powder was added with 1.25 N HCl solution in a ratio 1:15 (w / v), and heated for 1 hour at 90 °C. After that, the suspension was cooled, washed with distilled water to pH 5 and dried in an oven. The chitin that has been formed was treated further referring to [39], the precipitate colloidal that has been neutral was centrifuged for 5 minutes at 6000 rpm. The precipitate was autoclaved at 121 °C for 15 minutes and colloidal chitin was obtained.
Preparation of chitin agar medium
The process of making chitin agar medium was conducted by sterilized the equipment to be used using an autoclave at 121 °C for 20 minutes, and then 1% (w/w) colloidal chitin and 2% (w/w) agar were weighed, dissolved to seawater and put into the erlenmeyer. The solution was heated on a hot plate until thickened and homogeneous. Furthermore, the homogenate in the erlenmeyer was closed with a stopper and sterilized using an autoclave at 121 °C for 15 minutes. After the sterilization process was completed, the agar medium was poured into the pot, with added 50 g/mL ciprofloxacin, and exposed to the UV light. The chitin agar medium was covered with wrapped, and ready to be used for the isolation of endophytic microbial.
Isolation of endophytic microbial from root, stem, and leave parts
In laboratory handling, endophytic microbial isolation was conducted in the laminar air flow cabinet. Endophytic isolation steps refers to [13] with some modifications. In this study, roots, stems, and leaves of mangrove plants were isolated. First of all, the mangrove roots from the sampling were washed using distilled water until they were cleaned. Then, used the sterile knife to cutted the parts into small pieces. Next, the pieces of root were dipped in 70% alcohol for surface sterilization. After 120 seconds, the sterilization was stopped by immersing it in sterile seawater, and then the pieces of root are dried by aerating.
The pieces of root were placed in a pot containing chitin medium using sterile tweezers with the inside position of the root attached to the agar medium (1% w/w colloidal chitin, 2% w/w agar, and 50 g/mL ciprofloxacin in sterile artificial seawater). The pot containing the sample was closed and stored at room temperature. After 7-14 days, the growth of microbial will be seen around the pieces of root on agar medium [41]. Endophytic isolates showing different morphological properties were transferred to new chitin agar medium.
Purification of endophytic microbial
After the incubation process ended, colonies with different morphology were selected and purified using a scratch technique on new chitin agar medium. This purification aims to separate endophytic colonies with different morphology. Morphological observations were monitored every day and if macroscopically different colony growth was found, they were separated again to obtain a single isolate [13].
Cultivation of endophytic microbial
Endophytic microbial were cultivated to produce secondary metabolites in liquid medium according to [10] with several modifications. First, a liquid medium was prepared using sterile artificial seawater with 1% colloidal chitin. The medium was heated to boiled and sterilized by autoclave at 121 °C for 15 minutes.
Next, 1-2 ose of purified isolate was inoculated into liquid medium, and then it was incubated for 14 days at room temperature with physical observations during growth.
Extraction of compounds from endophytic microbial
The results of the cultivation of sample isolates whose activity was not known yet extracted using MeOH solvent, and then the MeOH extract was filtered and to be concentrated using a vacuum rotary evaporator with a pressure 123 mbar to obtain a crude extract. The extract was separated from the filtrate and the salt. The filtrate from MeOH crude extract was used for bioactivity screening test to determine the activity of the sample [13].
Maintenance of staphylococcus aureus and pseudomonas aeruginosa bacterial isolates
The bacteria used for bioactivity screening in this study were Staphylococcus aureus and Pseudomonas aeruginosa. The bacterial isolate used was a deposit in Unit Pelaksana Teknis Laboratorium Terpadu dan Sentra Inovasi Teknologi (UPT-LTSIT), University of Lampung. Rejuvenation of bacteria before being used for testing was conducted to get the bacteria in an active condition.
The equipment used are test tubes, skewers, and erlenmeyer which have been sterilized using an autoclave for 20 minutes at 121 °C with the pressure 2 atm. The media used in bacterial rejuvenation was Tryptic Soy Broth (TSB) where this media have nutrients that can support bacterial growth. This media was prepared by dissolving 3 g of TSB in 100 mL of distilled water and added 2% (w/w) agar. Furthermore, the media was sterilized using an autoclave for 15 minutes at 121 °C. The sterile medium was poured into a test tube and exposed to the UV light for 15 minutes in laminar air flow while the tube was tilted, and then 1 ose cultures of Staphylococcus aureus and Pseudomonas aeruginosa were taken then moved to different slanted TSB medium. Bacteria were incubated for 16-24 hours at 37 °C [13].
Screening bioactivity
The screening of bioactivity was conducted by the dilution method using a 96 wells microtiter plate which referred to [42] with several modifications. The test bacteria were used are Staphylococcus aureus and Pseudomonas aeruginosa.
Preparation inoculum bacteria
Inoculum was prepared usingTrypthic Soy Broth (TSB) and turbidity adjusted to the standard McFarland 0.5, and then the bacteria S. aureus and P. aeruginosa were diluted 1:100 in Broth media before used for testing.
Preparation of microbial extracts and antibiotics
Microbial and antibiotic extracts were prepared by making a solution in concentration 2000 ppm. The antibiotics used in this test were ciprofloxacin and chloramphenicol with concentration 2000 ppm which had been dissolved in 12.5% MeOH PA.
Screening of antibacterial activity against S. aureus and P. aeruginosa
195 μL of TSB media with 25 μL inoculum bacterial were added to the blanko into 96 wells microplate. The positive control contained 145 μL TSB media, 50 μL chloramphenicol (2000 ppm), and 25 μL inoculum bacterial. The negative control contained 145 μL TSB media, 50 μL MeOH PA 12.5%, and 25 μL inoculum bacterial. Control media contained 220 μL TSB media. The compounds used in the test were at concentration 2000 ppm. All sample were conducted in triple. Then, plate weels were incubated at 37 °C for 18-24 hours. After the incubation, bacterial growth was examined visually based on the color change of resazurin and measured at OD600nm using hospitex then the results were interpreted according to the standards of Clinical and Laboratory Standards Institute.
Cultivation and co-cultivation (Scalling up)
Co-cultivation was carried out based on the method of [8] with several modifications.
Selected strains are cultivated and co-cultivated on a larger scale. Large-scale cultivation is conducted by growing fungi on media contained sterile artificial seawater and 5% shrimp shell powder. This cultivation process used dark bottle capacity 2.5 L which filled 500 mL media. Incubation is carried out for 14-21 days. Cultivation was done with 3 repetitions.
Co-cultivation was done with 3 repetitions. The co-cultivation method was carried out by mixing the fungal and bacterial strains P. aeruginosa. The media used contained sterile artificial seawater and shrimp shell powder. Selected strains CDM14 were cultured on chitin agar medium for 1 week at room temperature.
The mycelium suspension was obtained by cutting the fungal mycelium on agar medium and transferred to dark bottle containing 250 mL of 5% shrimp shell powder medium, and then it was incubated at room temperature for four days under static conditions. Inoculum P. aeruginosa bacteria were cultured in dark bottles containing 250 mL media on the second day after fungal was cultured. Next, the bacteria were incubated for 48 hours under static conditions. After that, 250 mL bacterial seed broth was mixed with 250 mL fungal seeds in a 2.5 L dark bottle and incubated at room temperature for 14-21 days under static conditions.
Fungal identification
Selected isolates obtained from the screening steps were identified using the slide culture method referring to [43] with several modifications. The method is coverslip at an angle of 45° attached to the agar medium and the selected fungal colonies inoculate adjacent to one corner of the coverslip. After 3-4 days, the coverslip was slowly removed from the agar medium and the glass slide was added with methylene blue, and then the coverslip was placed on a glass slide and observed for hyphae, mycelium, spores, or conidia under a microscope and the results were documented.
Extraction cultivation and co-cultivation (Scalling up)
After incubation ended, samples were extracted with MeOH solvent. First of all, the results of cultivation and co-cultivation were sonified for 15 minutes to speed up the process of taking bioactive compounds contained in the media, and then it was centrifuged at 7000 rpm for 15 minutes. Filtrate was collected and the solid was re-extracted using MeOH solvent to take out the bioactive compounds that were still left in the solid. The extraction step is carried out until the maserate bath is colorless (possibly the metabolites have been completely extracted). Furthermore, the filtrate and the extracted liquid were combined, and then MeOH fraction was concentrated with a rotary evaporator to obtain a concentrated MeOH extract [8].
Liquid-liquid extraction (Partitioning)
Partition method was used to separate the non-polar to polar compounds in the MeOH fraction. In this study, n-Hexane was used to attract non-polar components, n-ButOH to attract semi-polar components, and H2O to attract polar components. The fractions were checked for separation patterns using the TLC. After a significant separation pattern was seen, the n-Hexane, n-ButOH, and H2O fractions were concentrated using a vacuum rotary evaporator to obtain a crude extract [13].
Thin layer chromatography test
Thin Layer Chromatography (TLC) was carried out to determine the chromatogram pattern resulting from the separation of compounds contained in the sample. The crude extract was analyzed by TLC using silica plate F254 as the stationary phase. The eluent used is a combination of n-Hexane and Isopropyl alcohol (IPA) with a certain ratio that has been pre-saturated. After elution of the TLC plate, the spots were seen under a UV lamp with a wavelength of 254 nm. The results of the chromatogram were sprayed using cerium sulfate reagent to reveal the TLC results and dried on a heater. Cerium sulfate reagent is used to determine the content of organic compounds in the sample by marking the appearance of blackish brown spots. Further observations were made using Dragendorff' reagent and Ninhydrin. Dragendorff reagent was used to determine the presence of alkaloid compounds (N-tertiary group) which was characterized by the formation of orange spots on the TLC results. Ninhydrin reagent was used to determine the presence of amino acid compounds (NH2 group) which was indicated by the formation of a purple color. The results TLC plate was observed and the Rf value calculated to determine the level of polarity of each component [13].
Fractionation using column chromatography
The fraction which is known to contain more dominant compounds fractionated using a chromatographic column. In this study, column chromatography was carried out several times using different stationary phases, namely silica gel and sephadex LH-20. Elution was carried out with several solvent gradient systems (non-polar to polar solvent systems). Open column containing a stationary phase (silica gel/ sephadex LH-20) is slowly entered from above with liquid solvent (mobile phase) flowing down with the help of gravity. Once the column is ready, the sample is loaded at the top of the column. The mobile phase is flowed through the column. The compounds in the mixture have different interactions with the stationary phase (silica gel/sephadex LH-20) and the mobile phase, so the time required to flow into the reservoir is different. The column liquids were collected as fractions and further analyzed for structural analysis. The presence of compound components from the separated fractions was monitored again by the TLC method using a cerium sulfate reagent [14].
Characterization of the compound
Samples that gave a tailless spot were analyzed using Ultraviolet-Visible Spectrophotometry (UV-Vis), Gas Chromatography-Mass Spectrometry (GC-MS), and Fourier Transform-Infrared Spectrometry (FTIR) instruments [21].
Results and Discussion
Chitin colloid production
Figure 1 exhibits the colloidal chitin obtained from shrimp shell extract as a medium for use microbial isolation. The process of making chitin is carried out by deproteination and demineralization steps, adopted from Hendri et al. [44]. First, the deproteination steps using NaOH aims to remove the protein present in the shrimp shell, as form Na-proteinate. The Na+ ion from NaOH will bind to the end of the negatively charged protein chain (COO-) to form a precipitate.
The precipitate obtained was washed using distilled water so that the precipitate could be free from NaOH. Next, the demineralization step using 1.25 N HCl causes air bubbles from CO2 gas, this indicates that there is a separation of calcium minerals from the sample. After one hour, the cold suspension was washed with distilled water to pH 5 to prevent product degradation, and then the precipitate was dried in an oven to remove the moisture content [44, 45].
Finally, the chitin formed was subjected to further treatment referring to [39, 46] to obtain colloidal chitin which can be used as a source of carbon (nutrients) in the medium.
Biomaterial
Figure 2 illustrates the biomaterial samples in a muddy, moist, and oily soil environment. Biomaterial samples were taken randomly from the mangrove area in Pesawaran, Lampung, with the coordinates of -5.509946°LS 105.256082°E with a radius of 7.0 km.
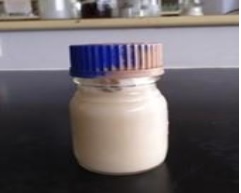
Figure 1: Colloidal Chitin (Source: Photograph courtesy of Syaiful Bahri. Copyright 2021)
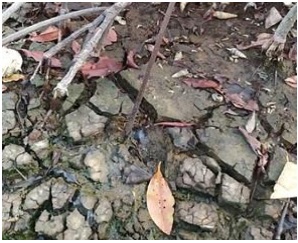
Figure 2: Mangrove environmental conditions at the time of sampling (Source: Photograph courtesy of Syaiful Bahri. Copyright 2021)
Meanwhile, Figure 3 is the results of sampling, obtained 12 samples A. marina, namely 6 mangrove roots, 3 mangrove stems, and 3 mangrove leaves that were not infected with microbial and there were no insect bite wounds.
Isolation of microbial from mangroves
Figure 4 demonstrates the isolation of the grown endophytic microbial. Isolation of microbial from mangroves was carried out using selective medium so that chitin was added with ciprofloxacin. Based on observations, microbial growth in roots, stems, and leaves experienced growth rates at different times, starting from the 7th to the 14th day. This is indicated by the growth of fibers in the inner part of the mangrove planted on agar medium.
The mixed microbial that grew were then transferred back to a new agar medium until a single colony was obtained as shown in Figure 5 (b). Dudeja and Giri [47] stated that endophytic populations in plant species very widely and depend on the host species, steps of host development, inoculum density, and environmental conditions.
In this study, 15 microbial isolates have been isolated have different colony colors. This difference indicates the diversity of microbial species associated with mangroves. Each plant one or more types of endophytic microbial can be found according to Strobel and Daisy [48].
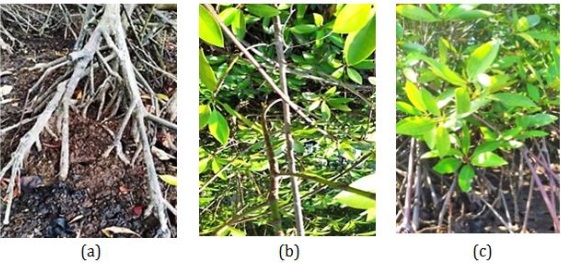
Figure 3: Mangrove Plant Organs (a) roots, (b) stems, and (c) leaves (Source: Photograph courtesy of Syaiful Bahri. Copyright 2021)
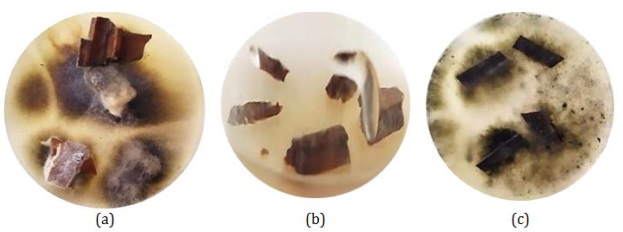
Figure 4: Microbial in mangrove organs (a) roots, (b) stems, and (c) leaves (Source: Photograph courtesy of Syaiful Bahri. Copyright 2021)
Colony colors obtained were pink, pink-purple, light green, dark green, and blackish. Each isolate was derived from 10 root isolates marked with codes CAM1, CAM2, CAM3, CAM4, CAM5, CAM6, CAM7, CAM8, CAM9, and CAM10, 3 stem isolates marked with codes CBM11, CBM12, CBM13, and 2 leaves isolates marked with the codes CDM14 and CDM15.
Microbial cultivation
To obtain secondary metabolites, fermentation (cultivation) is carried out using a 25 mL chitin liquid medium. This cultivation was carried out by adding 1% (w/w) colloidal chitin to sterile seawater. Microbial growth began to be seen on the 5th day. After 14 days, it could be seen that the medium had fibrous clumps and the medium changed from colorless to yellowish (Figure 6). The color change in this medium indicates that the microbial has produced secondary metabolites.
Furthermore, the microbial were extracted with the addition MeOH solvent to attract the component of compounds that have the same polarity as MeOH. The result is a yellowish extract. Each extract was concentrated using a vacuum rotary evaporator at 40 °C and the pressure 123 mbar to obtain a CDM14 crude extract (Figure 7).
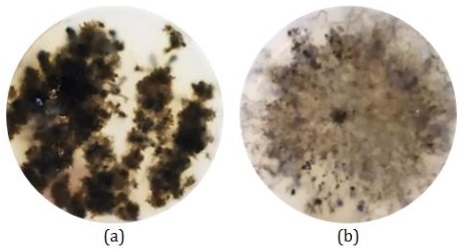
Figure 5: Isolates in mangrove plants (a) mixed colonies and (b) single colonies of CDM14 (Source: Photograph courtesy of Syaiful Bahri. Copyright 2021)
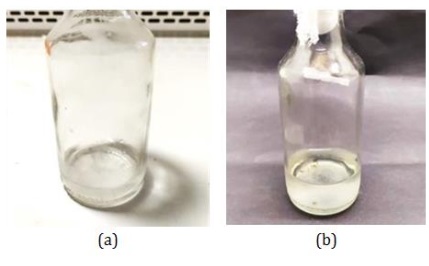
Figure 6: Microbial grown on chitin liquid medium (a) 0 days (b) 14 days (Source: Photograph courtesy of Syaiful Bahri. Copyright 2021)
Screening bioactivity
To know the characters of secondary metabolites, bioactivity screening was carried out against 2 types of bacteria namely Gram-positive and Gram-negative bacteria. The test was carried out using microtiter plate 96-weels with sample concentration 2000 ppm. In this study, Staphylococcus aureus was used as Gram-positive bacteria and Pseudomonas aeruginosa as Gram-negative bacteria. The results of antibacterial screening using S. aureus bacteria can be seen in Figure 8.
In Gram-positive bacteria, the blanko wells (A1-A3) and negative control (A7-A9) changed to pink after the addition of resazurin, this indicated that the bacteria were still alive and MeOH PA 12.5% solvent used did not affect or does not inhibit the activity of bacterial growth. Meanwhile, the positive control wells (A4-A6) and control medium (H10-H12) remained blue, this indicates that the antibiotics used as positive controls played a role in inhibiting bacterial growth, and the control medium did not have contamination. The results of screening using S. aureus bacteria showed that all samples did not have antibacterial activity against the bacteria. This was because all samples were reduced by the non-fluorescent compound resazurin (blue) to fluorescent resorufin (pink) indicating that the bacterial cells were still able to survive [49-51].
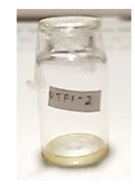
Figure 7: CDM14 crude extract (Source: Photograph courtesy of Syaiful Bahri. Copyright 2021)
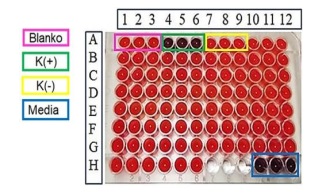
Figure 8: Antibacterial screening using S. Aureus. (Source: Photograph courtesy of Syaiful Bahri. Copyright 2021)
Table 1. Antibacterial screening using staphylococcus aureus information
|
Information |
|
A1-A3: Blank |
|
A4-A6: Positive control (+) |
|
A7-A9: Negative control (-) |
|
A10-A12: Crude CAM1 |
|
B1-B3: Crude CAM2 |
|
B4-B6: Crude CAM3 |
|
B7-B9: Crude CAM4 |
|
B10-B12: Crude CAM5 |
|
C1-C3: Crude CAM6 |
|
C4-C6: Crude CAM7 |
|
C7-C9: Crude CAM8 |
|
C10-C12: Crude CAM9 |
|
D1-D3: Crude CAM10 |
|
D4-D6: Crude CBM11 |
|
D7-D9: Crude CBM12 |
|
D10-D12: Crude CBM13 |
|
E1-E3: Crude CDM14 |
|
E4-E6: Crude CDM15 |
|
H10-H12: Medium control |
Based on these results, re-screening was carried out using Gram-negative bacteria, namely Pseudomonas aeruginosa as shown in Figure 9. In Gram-negative bacteria, the blanko wells (A1-A3) and negative control (A7-A9) changed color from blue to purplish red which indicated that the bacteria were still alive, this indicated that MeOH solvent 12.5% used did not affect or does not inhibit the activity of bacterial growth, so that the bacteria are still able to survive.
The positive control wells (A4-A6) and control medium (H10-H12) did not change color, this indicates that the antibiotics used as positive controls played a role in inhibiting bacterial growth, and the control medium did not have contamination. Figure 9 illustrates the results of the screening test for P. aeruginosa bacteria. It was observed that, in general, all samples exhibited a change in resazurin color from blue to pink, indicating that the bacteria remained viable, and none of the samples displayed antibacterial properties. However, when viewed in detail from the color of the resulting wells, the CDM14 (E1-E3) wells have a color that similar to the positive control. Therefore, to re-confirm the test results, the selected isolate CDM14 was scaled up and re-tested for bioactivity.
Identification of morphology fungi CDM14
The CDM14 isolate morphologically identified to determine the type of isolate. This observation was carried out macroscopically by looking at the color of the colonies and microscopically by looking at the characteristics of the isolates using a microscope.
Macroscopic observation
Based on macroscopic observations, CDM14 fungal colonies initially had a blackish brown color, a slightly starchy surface, and the opposite color of the colony was black with irregular colony edges, as shown in Figure 10.
However, after repeated rejuvenation, the CDM14 fungi changed colony pigmentation because the fungi had undergone significant adaptation to the medium used.
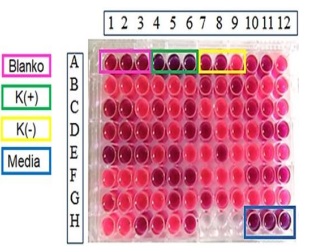
Figure 9: Antibacterial screening using P. Aeruginosa (Source: Photograph courtesy of Syaiful Bahri. Copyright 2021)
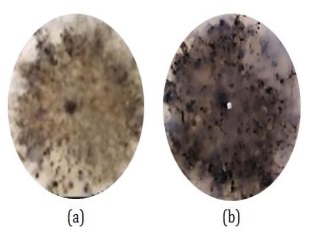
Figure 10: Macroscopic observations of CDM14 (a) the surface of the colony and (b) the reverse color of the colony (Source: Photograph courtesy of Syaiful Bahri. Copyright 2021)
Table 2. Antibacterial screening using pseudomonas aeruginosa information
|
Information |
|
A1-A3: Blank |
|
A4-A6: Positive |
|
control (+) |
|
A7-A9: Negative |
|
control (-) |
|
A10-A12: Crude |
|
CAM1 |
|
B1-B3: Crude CAM2 |
|
B4-B6: Crude CAM3 |
|
B7-B9: Crude CAM4 |
|
B10-B12: Crude |
|
CAM5 |
|
C1-C3: Crude CAM6 |
|
C4-C6: Crude CAM7 |
|
C7-C9: Crude CAM8 |
|
C10-C12: Crude CAM9 |
|
D1-D3: Crude CAM10 |
|
D4-D6: Crude CBM11 |
|
D7-D9: Crude CBM12 |
|
D10-D12: Crude CBM13 |
|
E1-E3: Crude CDM14 |
|
E4-E6: Crude CDM15 |
|
H10-H12: Medium control |
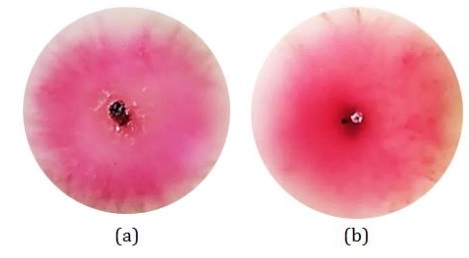
Figure 11: Macroscopic observations of CDM14 after repeated rejuvenation (a) colony surface and (b) reverse color of the colony (Source: Photograph courtesy of Syaiful Bahri. Copyright 2021)
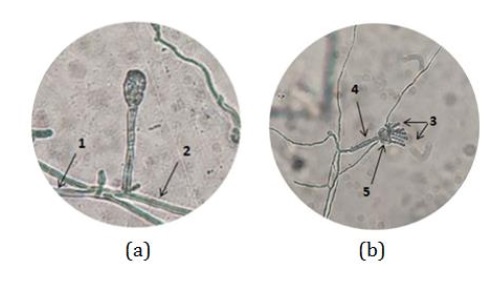
Figure 12: Macroscopic identification of the CDM14 fungus using the Axioo Zeiss Imager A1 microscope (Source: Photograph courtesy of Syaiful Bahri. Copyright 2021)
This change resulted in the color of the surface and reverse colonies of the fungi being pink with irregular edges, as illustrated in Figure 11.
Microscopic observation
Microscopic observations were carried out using an Axioo Zeiss Imager A1 microscope. The results of microscopic identification CDM14 fungi after being planted using the slide culture method for 3 days can be seen in Figure 12. Microscopic visualization in Figure 12a shows the mycelium (1) and hyphae (2) Figure 12b shows the presence of conidia (3), conidiophores (4), and phialides (5). The results of the identification observed in Figure 12a show the presence of mycelium (1) which is a branching hyphae and hyphae (2) which consists of fungal cells. In Figure 12b, it can be seen that conidia (3) which function as a means of asexual reproduction in fungi by producing spores, conidiophores (4) which function as spore holding stalks (conidia), and phialides (5) are conidiogenous cells which produces conidium. Other characteristics are seen in the conidiospores of the CDM14 fungi, the conidiophores are elongated and the spore bearing structure is like a brush based on macroscopic and microscopic observations [52-54].
Cultivation and co-cultivation (Scalling up) of CDM14
CDM14 isolate was carried out by scaling up cultivation (CDM14M) and co-cultivation (CDM14B) using 500 mL dark bottles each with 3 repetitions. The scaling up process was carried out using semi-solid medium with 5% shrimp shell powder and each was repeated 3 times. Co-cultivation was carried out using the bacterium Pseudomonas aeruginosa to induce the biosynthesis of silent gene clusters thus leading to the accumulation of undetectable metabolites in a culture [55, 56]. The addition of bacteria to this fungi growth medium can significantly increase the production of fungal bioactivity, as shown in Figure 13.
After 14-21 days, it can be seen that on the surface of the cultivation and co-cultivation medium, fungi mycelium has grown. Visual observations showed that there was a difference between the growth of fungi without bacteria and the growth of fungi with added bacteria. Cultivation of fungi without bacteria showed that fungi grew evenly on the surface of the medium.
Meanwhile, in co-cultivation there was competition between fungi and bacteria which resulted in not all fungi being able to grow on the medium. This competition among microbial is deliberately provoked in the hope that biosynthetic genes that remain quiescent in culture can be activated and transcribed under stress conditions [55, 56].
The results of cultivation and co-cultivation were separated from the medium by centrifugation to produce a yellowish filtrate and a brownish solid (Figure 14). The solid was re-extracted using MeOH solvent to take the bioactive compounds that were still left in the solid.
The obtained liquid was concentrated using a vacuum rotary evaporator at pressure 123 mbar to produce extracts CDM14M1 (1.5 g), CDM14M2 (1.8 g), CDM14M3 (1.9 g), CDM14B1 (1.6 g), CDM14B2 (1, 8 g), and CDM14B3 (1.4 g). The MeOH extract was checked for component using Thin Layer Chromatography (TLC) with n-Hexane: IPA (3:1) as eluent. The results of the TLC test using silica as the stationary phase and the eluent n-Hexane: IPA (3:1) are shown in Figure 15.
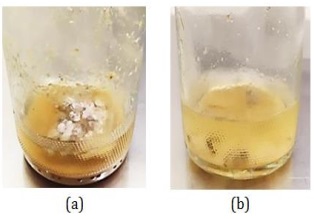
Figure 13: Scaling up semi-solid medium (a) cultivation of fungi without bacteria and (b) co-cultivation of fungi using P. aeruginosa bacteria (Source: Photograph courtesy of Syaiful Bahri. Copyright 2021)
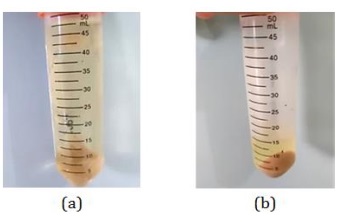
Figure 14: Centrifugation results (a) cultivation and (b) co-cultivation (Source: Photograph courtesy of Syaiful Bahri. Copyright 2021)
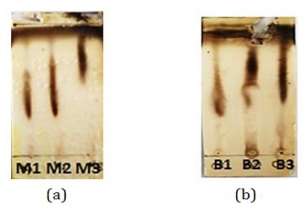
Figure 15: TLC test results (a) cultivation and (b) co-cultivation (Source: Photograph courtesy of Syaiful Bahri. Copyright 2021)
Based on the results of TLC, different Rf values were obtained in the cultivation and co-cultivation medium. In cultivation, black spots are seen at Rf 0.3 to 0.6. Meanwhile, in co-cultivation, Rf values were obtained from 0.3 to 0.4.
This difference in Rf value indicates that there are differences in secondary metabolites between the cultivated and co-cultivated extracts. Both extracts were then screened for bioactivity again with concentration 2000 ppm using P. aeruginosa bacteria (Figure 16).
The screening results showed that all CDM14 extracts from cultivation and co-cultivation did not have antibacterial activity against P. aeruginosa bacteria, which was indicated by a change in the color of all extract pits to pink. This color change was caused by the reduction of the non-fluorescent compound resazurin (blue) to fluorescent resorufin (pink) which indicated that bacterial cells were still able to survive and all samples could not resist the growth of P. aeruginosa bacteria. Although, all samples did not show activity as antibacterial, the research was continued by focusing on the analysis of the structure of the compound and further suggested to do other bioactivity tests, such as antibiofilm and antifungal.
Extracts of CDM14M1, CDM14M2, and CDM14M3 (cultivation) were then combined and given a new code, namely CDM14M. Meanwhile, extracts of CDM14B1, CDM14B2, and CDM14B3 (co-cultivation) were combined and given a new code, namely CDM14B. The results of the combination were concentrated again until the weight of CDM14M was 5.2 g and CDM14B was 4.8 g. The TLC test was then carried out to see contained in the two extracts. The results of the TLC test using silica stationary phase and 100% n-Hexane eluent can be seen in Figure 17.
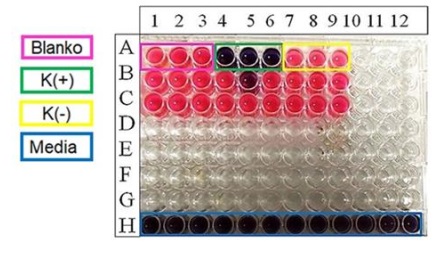
Figure 16: Cultivation screening and scale-up co-cultivation using P. Aeruginosa (Source: Photograph courtesy of Syaiful Bahri. Copyright 2021)
Table 3. Cultivation screening and scale-up co-cultivation using P. aeruginosa information
|
Information |
|
A1-A3: Blank |
|
A4-A6: Positive control (+) |
|
A7-A9: Negative control (-) |
|
B1-B3: Crude CDM14M1 |
|
B4-B6: Crude CDM14M2 |
|
B7-B9: Crude CDM14M3 |
|
C1-C3: Crude CDM14B1 |
|
C4-C6: Crude CDM14B2 |
|
C7-C9: Crude CDM14B3 |
|
H1-H12: Medium control |
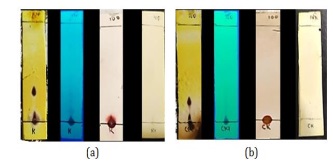
Figure 17: TLC test results sequentially using Ce(SO4)2, UV-Visualization at 254 nm, ninhydrin reagent, dragendorff reagent (a) crude CDM14M and (b) crude CDM14B (Source: Photograph courtesy of Syaiful Bahri. Copyright 2021)
Based on the TLC spots pattern obtained using the reagent Ce(SO4)2. In general, there were 2 brownish black spots on both extracts which indicated that there were organic compounds with different polarity properties. Specifically, the spots between cultivation and co-cultivation have different shapes which are influenced by the effect of adding bacteria to co-cultivation. This can be seen from the values Rf = 0 and Rf = 0.33 on crude CDM14M, shown in Figure 25a and the values Rf = 0 and Rf = 0.26 on crude CDM14B, as shown in Figure 17b. The different component profiles in the two extracts indicated that there were differences in the secondary metabolites produced between cultivated and co-cultivated fungi. This difference was caused by the growth of bacteria induced in the co-cultivation medium.
Furthermore, visualization using 254 nm of the UV light showed that in the crude CDM14M and crude CDM14B compound components, conjugated double bonds were detected which were indicated by black spots at Rf=0. The ninhydrin specific reagent showed purplish spots on the bottom spot, this indicated the presence of NH2 groups in both crudes. However, in dragendorff's reagent the two crudes did not show any orange spots, this indicates that there is no tertiary N- group in the compound components. Furthermore, the compounds present in crude CDM14M and CDM14B were partitioned using a separating funnel to separate the components based on their polarity.
Extract partition CDM14M and CDM14B
First of all, the separation steps of the liquid-liquid extraction method (partition) were carried out using n-Hexane to attract non-polar components and H2O to attract polar components. Partitioning was done by adding the solvent n-Hexane:water (1:1) with 3 repetitions. The partition results obtained the upper fraction (n-Hexane) and the lower fraction (water), as depicted in Figure 18.
The brick red water fraction was separated again using n-ButOH solvent to attract the semi-polar component. The obtained fractions are the upper phase (n-ButOH) and the lower phase (H2O), as shown in Figure 19.
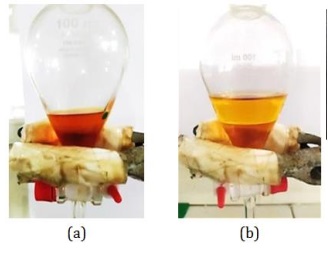
Figure 18: Partition results using n-Hexane:water (1:1) (a) CDM14M and (b) CDM14B (Source: Photograph courtesy of Syaiful Bahri. Copyright 2021)
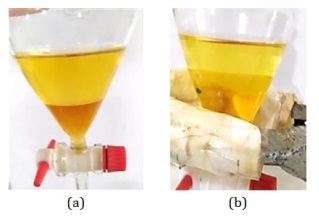
Figure 19: Partition results using n-ButOH (a) CDM14M and (b) CDM14B (Source: Photograph courtesy of Syaiful Bahri. Copyright 2021)
The partition results obtained were evaporated to obtain a thick extract. In CDM14M, the wet weight of the n-Hexane fraction was 0.3 g, the n-ButOH fraction was 1.4 g, and water fraction was about 3.3 g. In CDM14B, the wet weight of the n-Hexane fraction was 0.1 g, the n-ButOH fraction was 1 g, and water fraction was 4.6 g. Each fraction was subjected to a TLC test to determine whether the separation had occurred in the fractions. The results of the separation using cerium sulfate reagent with silica as a stationary phase and 100% n-Hexane eluent can be seen in Figure 20.
The TLC test data showed that in general there had been separation between the H2O, n-ButOH, and n-Hexane fractions. Characterized by the difference Rf in each fraction. A good separation pattern is seen in the CDM14M compound, where water fraction is at a value of Rf=0 extending to Rf=0.3, n-ButOH fraction at Rf=0.2 extends to Rf=0.6, and the n-Hexane fraction at Rf=0.5 extends to Rf=0.7.
Meanwhile, in the CDM14B compound, the fractions resulting from the separation showed more characteristics towards polar compounds. This is indicated by the water fraction which is at a value of Rf=0, the n-ButOH fraction at Rf=0 extends to Rf=0.2, and the n-Hexane fraction at Rf=0 extends to Rf=0.5. The difference in the separation pattern was due to the different properties of the secondary metabolites in CDM14B caused by the addition of bacteria to the medium.
In detail, when compared to other fractions, the separation pattern in the n-Hexane CDM14M fraction was more visible, indicated by the presence of 3 thick spots on the TLC plate. Therefore, based on the separation pattern of the compound components, the research was continued on the n-Hexane CDM14M fraction.
Fraction n-hexane CDM14M
The n-hexane CDM14M fraction was then tested by TLC to find the eluent to be used in open column chromatography. The results of the TLC test using cerium sulfate reagent are displayed in Figure 21. The test results using TLC showed that the method used was the method of increasing the polarity in steps, from non-polar to polar solvents. Based on these data, the fractionation was carried out using a silica stationary phase and a mobile phase with a solvent gradient ranging from n-Hexane (100%), n-Hexane:IPA (9:1), n-Hexane:IPA (7:3), n-Hexane :IPA (1:1), to Isopropyl Alcohol (100%). The selection of the eluent was based on the Rf value, shape, number of spots produced, and the pattern of separation of the compounds in Figure 21.
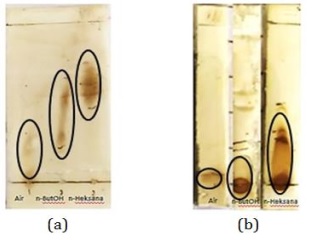
Figure 20: TLC test partition results from left to right (water fraction, n-ButOH, n-Hexane) (a) CDM14M and (b) CDM14B (Source: Photograph courtesy of Syaiful Bahri. Copyright 2021)
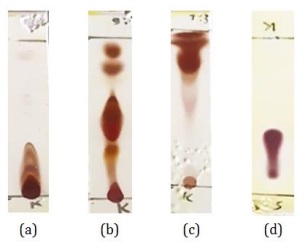
Figure 21: TLC test results for the n-Hexane CDM14M fraction using several solvent gradients (a) n-Hexane 100%, (b) n-Hexane:IPA (9:1), (c) n-Hexane:IPA (7:3), and (d) n-Hexane:IPA (1:1) (Source: Photograph courtesy of Syaiful Bahri. Copyright 2021)
Fractionation using a pencil column
The fractions produced by the column using silica were obtained 25 fractions. All fractions were tested by TLC to determine the distribution pattern of organic compounds contained in each bottle of fractions. The chromatogram pattern of the 25 fractions resulting from column chromatography using n-Hexane: IPA (9:1) eluent can be seen in Figure 22. Based on the chromatogram of TLC results, the fractions showed the distribution pattern of organic compounds. Interpretation using cerium sulfate produces black spots with variation Rf values. Broadly, there are several fractions that have similar Rf values, namely 6-8 fraction group, 9-19 fraction group, and 22-23 fraction group. In detail, the groups of fractions have different spot thicknesses, namely in the form of thin spots and thick spots. The difference in thickness is the reason that the fractions are not combined first. Further observations were then prioritized on fraction 20. Interpretation using cerium sulfate resulted in 3 spots. One of the spots is at Rf=0.1 extending to Rf=0.6 and has a fairly thick thickness (Figure 22).
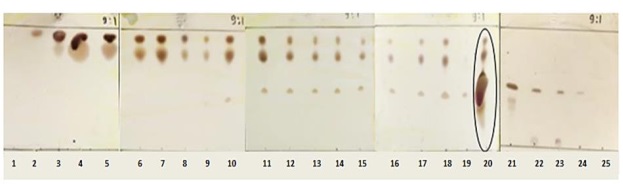
Figure 22: Column TLC chromatogram using cerium sulfate reagent (Source: Photograph courtesy of Syaiful Bahri. Copyright 2021)
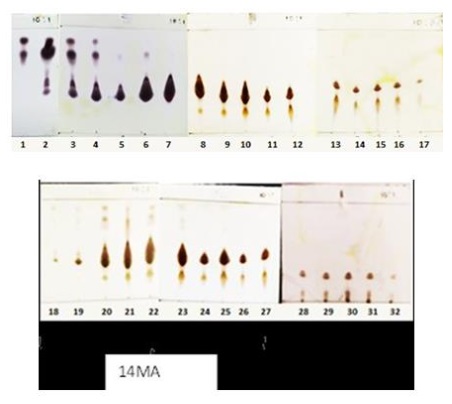
Figure 23: TLC results using cerium sulfate reagent (Source: Photograph courtesy of Syaiful Bahri. Copyright 2021)
The column results show that fraction 20 has an orange color and weighs 110.4 mg. This is the reason that fraction 20 is prioritized for further fractionation.
Fraction 20 was carried out by column chromatography again using a silica stationary phase and a gradient mobile phase from n-Hexane:IPA (10:1) and n-Hexane:IPA (1:1) resulting in 32 fractions. Each fraction produced by the column was tested by TLC using the silica stationary phase and the mobile phase n-Hexane:IPA (10:1) to determine the compound components in each fraction, as shown in Figure S1 (Supporting imformatiom).
The spots detection in the TLC test showed that the resulting column fractions does not have good separation, indicated by the number of spots with tails in the fractions. Concerning this and the chromatogram pattern, fractions 18-27 were combined and coded as 14MA. The fraction was then weighed and the weight was 33.3 mg. The components contained in the 14MA fraction were detected by TLC test using a silica stationary phase and a mobile phase n-Hexane:IPA (10:1), as demonstrated in Figure 26. The TLC test results showed a brownish stain, shown in Figure S2a (Supporting imformatiom) extending from the bottom spot to Rf=0.7 and the compound had a conjugated double bond which was detected at 254 nm of the UV light, see in Figure S2b (Supporting imformatiom).
These indicate that the 14MA fraction still has compounds that are polar to non-polar and there is a strong interaction between the –OH group in the silica and the compound components in the sample so that fraction is difficult to separate using silica as the stationary phase.
Based on these data, further separation was carried out using the stationary phase sephadex LH-20 (Figure S3, Supporting imformatiom) which aims to separate the components of the compound based on particle size or molecular weight. Components with a larger molecular weight will come out first compared to those with a smaller molecular weight. The sephadex gel used previously had been soaked in organic solvent EtOH (ethanol) for 12 hours.
The fraction produced by the column using the stationary phase sephadex LH-20 produced 20 fractions. The chromatogram pattern of 20 fractions using a silica stationary phase and an n-Hexane:IPA (10:1) mobile phase can be seen in Figure S4 (Supporting imformatiom).
The results of visualization of the TLC test using cerium sulfate reagent showed that all fractions in general had a similar Rf value of 0.5. However, in detail, there are differences between these fractions, namely from the brownish spots with tails as clearly seen in fractions 6-10. These spots indicate that each fraction still contain impurities. Accordingly, the fraction that showed a better chromatogram pattern than the others was chosen for the characterization of the compounds, namely fraction 10 (14MA10) for characterization using UV-Vis and FT-IR and fraction 15 (14MA15) for characterization using GC-MS.
Characterization of CDM14
Mass spectrometry (GC-MS)
Based on the analysis using GC-MS of the n-Hexane fraction 14MA15, the spectrum is obtained, as depicted in Figure S5 (Supporting imformatiom).
The results of the analysis showed that in the 14MA15 fraction there were still many peaks which indicated that the compound was still not pure. The compounds that were successfully analyzed from the GC-MS can be seen in Table 4.
There are 10 dominant peaks identified, including compounds that have high to low probability. The probability level of the compound indicates how much the compound is similar to the existing database National Institute of Standards and Technology (NIST). Based on peak shape, peak 8 was selected to proceed to the next analysis. The eighth peak shows a probability 84.03%, retention time of 49.967 minutes, 10.36% peak area, and has a molecular weight of 384 m/e. Based on MS data, compound 14MA15 is indicated to have the molecular formula C26H40O2, has no N atom, and have similarities with the basic framework of steroid compounds ergosterol type. The spectrum of the compound components at the eighth peaks, see Figure S6a (Supporting imformatiom).
Table 4: Compound components in the 14MA15 fraction
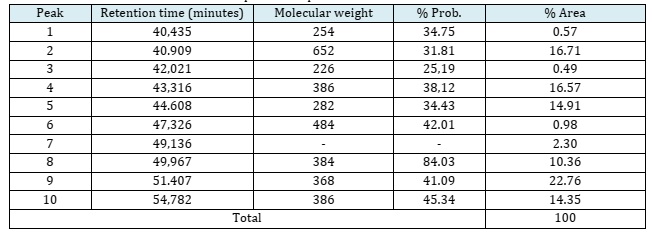
The MS spectra of the eight peaks of compound 14MA15 showed the presence of fragmentation peaks at m/z 366, m/z 143, m/z 135, and m/z 40. The mass spectrum data were similar to the specific fragmentation of steroid compounds, namely the presence of fragmentation in ring B with m/z 135 [57, 58]. In addition, the fragmentation pattern has similarities with MS data for steroid compounds of the ergosterol type available at the National Institute of Standards and Technology (NIST) with values of m/z 393, m/z 363, m/z 253, m/z 143, m/ z 131, m/z 43, and m/z 41. Based on the major fragments in the MS spectrum of compound 14MA15, the possible fragmentation pattern that occurs is shown in Figure S7 (Supporting imformatiom). The eighth peak MS data showed that the molecular weight of the compound obtained was 384. Further analysis at the base peak m/z 366 showed that there was fragmentation of the H2O (M-18) group from m/z 384 and McLafferty rearrangement [59].
At m/z 241 (M-143) there was fragmentation of the C-C bond located next to the C=O group which resulted in the release of the C=O group and continued with the fragmentation of the side group. Furthermore, at the peak with an m/z value of 135 (M-249) indicated the presence of a C7-C8 and C9-C10 bond breaking in the steroid B ring [59]. The presence of an m/z 41 (M-343) peak was due to the termination of one of the electrons in the bond of the ethylene group accompanied by McLafferty rearrangement to form an allylic cation [60].
Characterization using Ultraviolet-Visible Spectrophotometry (UV-Vis)
Confirmation of light absorption in the ultraviolet (200-400 nm) and visible light (400-800 nm) in the 14MA10 fraction using concentrated methanol as a solvent to determine the presence of conjugated double bonds. The UV-Vis spectrum can be seen in Figure S8 . The results of the analysis showed a peak in the UV region with a wavelength of 206 nm and an absorbance of 1.60070 (AU). This peak is indicated as the peak of the C=O group of the conjugated cyclic ketone.
Characterization using Fourier Transform- Infrared Spectrometer (FTIR)
Furthermore, to confirm the functional groups present in the selected fraction 14MA10, an analysis was carried out using IR spectroscopy (see Figure S9, Supporting imformatiom). IR analysis showed an absorption at a wave number of 3410 cm-1 broad which indicated that there was an O-H group stretching from the alcohol. The absence of absorption in the wave number region of 3000-3100 cm-1 and overtones at 1600-2000 cm-1 indicated that the aromatic C=C group was not detected. Absorption at wave numbers 2924 cm-1 and 2852 cm-1 indicates the presence of aliphatic stretching C-H vibrations from alkyl groups. At a wave number of 1712 cm-1 absorption was found, this indicated the presence of a C=O ketone group in the compound (McMurry, [43]). Another interpretation indicates the presence of an alcohol C-O group at 1055 cm-1. In addition, in the fingerprint area there is absorption at 1463 cm-1, 1379 cm-1, and 723 cm-1, showing C-H sp3 scissor bonds, C-H sp3 stretching bonds, and the rocking vibration of the terminal –CH3 group, respectively. Furthermore, absorption at wave numbers 958 cm-1 and 800 cm-1 indicates the presence of C-H sp2 groups. Based on the description of the data above, the molecular formula C26H40O2 is suitable to be proposed.
Conclusion
To sum up, we have concluded that as many as 15 microbial have been isolated from 12 mangrove plant organs. In addition, the bioactivity screening conducted on the sample microbials showed that the isolates were not antibacterial against Staphylococcus aureus and Pseudomonas aeruginosa bacteria. Furthermore, the screening for scaling up cultivation and co-cultivation of CDM14 showed that the isolate was not antibacterial against Pseudomonas aeruginosa. Finally, the characterization showed that the 14MA15 fraction had a molecular formula C26H40O2 with a skeleton similar to ergosterol.
Acknowledgments
The authors would like to thank the University of Lampung and team research.
Disclosure Statement
No potential conflict of interest was reported by the authors.
Funding
This research did not receive any specific grant from funding agencies in the public, commercial, or not-for-profit sectors.
Authors' Contributions
All authors contributed to data analysis, drafting, and revising of the paper and agreed to be responsible for all the aspects of this work.
ORCID
Syaiful Bahri
https://orcid.org/0000-0001-8928-2902
Annisa Elcentia Fajarwati
https://orcid.org/0009-0007-0597-4217
Andi Setiawan
https://orcid.org/0000-0002-0731-6417
John Hendri
https://orcid.org/0000-0002-8119-0701
Suripto Dwi Yuwono
https://orcid.org/0009-0004-5075-2670
Yuli Ambarwati
https://orcid.org/0000-0002-6738-709X
Rahadian Zainul
https://orcid.org/0000-0002-3740-3597
Supporting Information
Detailed TLC results, spectrum of GC-MS fraction 14MA15, MS spectrum the eighth peak of 14MA15 and ergosterol standard, Fragmentation pattern of the compound 14MA15, 14MA10 Uv-Vis spectrum, and IR spectrum of 14MA10 fraction (PDF).
HOW TO CITE THIS ARTICLE
Rahadian Zainul*, Syaiful Bahri, Annisa Elcentia Fajarwati, Andi Setiawan, John Hendri, Suripto Dwi Yuwono, Yuli Ambarwati, Steroid Compounds from Endophytic (Penicillium sp.) of Mangrove Avicennia marina. J. Med. Chem. Sci., 2024, 7(2) 402-425.
)