Document Type : Original Article
Authors
SRM College of Pharmacy, SRMIST, Kattankulathur, Chennai, Tamil Nadu-603203, India
Abstract
Background: Diabetes and hypertension are related illnesses that often coexist. Angiotensin receptor blockers like candesartan are typically used to treat Hypertension. A thiazolidinedione-type diabetes drug, pioglitazone helps those with type 2 diabetes manage their elevated blood sugar levels. The absence of a combination dose form on the market today may have industrial implications. Regulatory bodies advocate the use of a Quality by Design (QbD) methodology during the product development process to ensure product quality.
Objective: The current study strives to develop an oral bilayer matrix tablet of candesartan Cilexetil and pioglitazone increasing patient compliance and decreasing the frequency of doses for treating hypertensive cardiovascular damage.
Method: Poloxamer 407 was utilized as a polymer for immediate release. HPMC K4M and EUDRAGIT RS 100 for sustained release. Both layer blends were evaluated for precompression parameters. Using a 32-factorial design, the influence of the variables like disintegration time and time required for 100% drug release on Candesartan Cilexetil are measured.
Results: The results show that HPMC forms a synergistic gel; controlling Pioglitazone medication release for 20 hours. Batch F6 with 40 mg Eudragit produces a film around drug, limiting its release rate to 24 hours. Candesartan Cilexetil immediate release layer demonstrated 100% drug release at 15 minutes.
Conclusion: Quality by Design (QbD) approach offers an effective, efficient framework to incorporate Candesartan Cilexetil and Pioglitazone in a fixed dose bilayer tablet as this combo is beneficial for individuals who suffer from hypertension and type 2 diabetes.
Graphical Abstract
)
Keywords
- Candesartan Cilexetil
- Croscarmellose
- Mutual release dosage form
- Design expert
- Pioglitazone
- Poloxamer 407
Main Subjects
Introduction
Frequently, individuals with metabolic syndrome entail combination therapy [1]. This is a cluster of interconnected disorders (obesity, dyslipidemia, hyperglycemia, and hypertension) that raise the risk of type 2 diabetes and cardiovascular disease. It is a typical metabolic condition wherein incidence increases as the populace grows substantially obese. Various definitions of the illness exist. The metabolic syndrome was established as a possible diagnosis to help locate people who meet subjective standards for lifestyle adjustments and medication treatment, when necessary, with target of decreasing overall type 2 diabetes and cardiovascular disease concern. Patients should typically follow various pharmaceutical dosing regimens for metabolic illnesses, and these medications' dosing intervals are not always the same, which may have an adverse effect on patient adherence [2]. Medication compliance in patients with diabetes and heart failure was found to be just over 30% [3]. Numerous studies have demonstrated a negative correlation between compliance and regime intricacy, especially the quantity of the given pills. The term "fixed-dose combination-FDC" refers to a type of pharmaceutical preparations in which two or even more active constituents are contained in a single dose. By decreasing pill load and streamlining dosage regimes, FDC has now become the preferred option for improving the ease of drug delivery [4]. Likewise, a meta-analysis demonstrated the noncompliance likelihood with anti-hypertensive decreased by 24–26% in FDC-treated individuals than those taking specific medications [3]. Hence, FDC is endorsed as a promising formulation for chronic disorders requiring long-term and numerous pharmacotherapies to gain a satisfactory therapeutic efficacy [2]. The two compounds' physicochemical properties, compatibility, loading dose, and solubility characteristics should be taken into account while designing formulations for FDCs. As an alternative for generating FDC formulations, bilayer tablets are one of the finest possibilities for incorporating distinct dissolution profiles for each drug into a single dosage form. For example, SR and IR medications in a single dosage form. The active pharmaceutical ingredients (APIs) that are incompatible due to the physicochemical differences can also be overcome. Multiple sources have documented these prospective advantages of the bilayer tablet [5, 6]. It is easy to administer, patients are more likely to adhere, and these formulations can be modified to meet the patient's needs. It is crucial to examine parameters including stomach emptying, gastrointestinal transit time, drug release from the dosage form, and the localization of drug absorption in developing an effective oral drug delivery approach [7-9]. Thus, two medications are delivered in a fixed dose combination using the multilayered tablet concept in the development of the sustained release (SR) formulations [10, 11].
Patients with diabetes and hypertension must have strict and constant BP/blood glucose management, according to these reports. A blocker of the angiotensin type 1 (AT1) receptor (ARB) has been shown to have beneficial pleiotropic effects on various cardiovascular conditions, regardless of the blood pressure reducing implications [12, 13]. The combination of pioglitazone with an antihypertensive agent (ARB) is therefore of major clinical importance than the single drug in the treatment of hypertensive heart disease [14]. Candesartan Cilexetil, an angiotensin II receptor blocker (ARB), is frequently used to treat hypertension and lowers mortality along with morbidity. Pioglitazone hydrochloride, an efficient PPARg agonist, is frequently used to treat type 2 diabetes mellitus by reducing insulin sensitivity. It is an anti-hyperglycemic thiazolidinedione. It is found that pioglitazone had considerable positive effects on hypertensive cardiovascular damage, and these effects were significantly amplified by the combination with candesartan [15].
Before scaling up, to optimize a formulation in the initial stages of development, manufacturers can use Quality by Design (QbD). Formulation scientists will describe the material attributes (MA), quality attributes (QA), and process parameters (PP) needed to accomplish the QTTP (quality target product profiles) relying on target product profile and the workflow map (wet/dry granulation, tableting, and coating). The risks would be identified by the crucial characteristics and parameters, and also assessed using the compaction simulator based on the researcher's familiarity with the method and their previous research.
The current research focuses on a drug combination therapy for the management of hypertension which allows medications with different modes of action to operate together and successfully reduce blood pressure at dosages shorter than those recommended for each drug.
Materials and Methods
Candesartan Cilexetil and pioglitazone are obtained as freebies through Madras Pharmaceuticals, Chennai, Tamil Nadu. Dr. Reddy's Laboratories, Hyderabad, provided Poloxamer 407, HPMC K4M, Eudragit RS, croscarmellose sodium, and microcrystalline cellulose.
Methodology
Risk assessment
Critical quality attributes are the parameters which directly affect the safety and efficacy of the patient in relation to product and process development. The following are the criterion for considering a parameter as critical. In tablets, quality is considered as a critical parameter where assay and uniformity of dosage forms are assessed. Safety is the next critical parameter involving impurities and their related substances, residual solvents and microbiological limits. Efficacy is an important parameter concerned at absorption and dissolution levels. The other multidisciplinary attributes include patient compliance and patient acceptance. Critical quality attributes for the product and process development were assessed, as provided in Table 1.
Quality risk assessment can be done by risk identification by Ishikawa fishbone, risk analysis through relative risk-based matrix analysis, risk evaluation using failure mode effective analysis. Using fundamental risk management facilitation, the experiment's risk assessment was conducted, as demonstrated in Figure 1.


To identify critical parameters which could possibly affect the immediate release formulation, this diagram was drawn and possibilities of potential risks were identified. Major critical attributes that would affect the immediate release of drug were recognized as solubility and dissolution of drug. The variables which contribute to these factors were identified as type of super disintegrant and carriers used as well as their concentrations. These were determined from extensive literature survey and the quantities to be used were optimized by employing design of experiments method with the aid of Design Expert, Stat ease software, USA.
Experimental design [16]
Design of Experiments is a systematic series of trials where intentional changes are made to input factors to assess causes for significant changes in output responses and evaluating the connection between variables and responses in order to evaluate all potentially relevant factors simultaneously, systematically, and quickly. The perfect process understanding will aid in improved product formulation and eventual process scale-up, while simulating the quality and performance of the finished product. Design expert software - Design Expert, Stat Ease, USA was employed for simulating the experimental conditions. In attempt to develop the IR layer for the bilayer tablet, a 32 full factorial design was utilized.
In accordance with the literature and risk assessment, the independent variables selected were polymer concentration and super disintegrant concentration. Concentrations of independent variables utilized in this factorial design were determined via a series of preliminary trial batches, as indicated in Table 2. Using the experimental design, the experimental conditions were simulated. There are three levels of polymer to choose from, ranging from 8 mg to 40 mg. The impact of super disintegrant on drug release was investigated at three concentrations (0.5, 1, and 1.5 mg).
Preparation of solid dispersions of candesartan cilexetil by solvent evaporation method
Candesartan Cilexetil is a BCS Class II drug hence classifies as drug with low solubility but is a cascading prodrug and is considered unique for its low maintenance dose. Hence a dire need to enhance its solubility exists in the formulating industry to utilize its benefits to the maximum levels. As solid dispersion is one the potential methods to enhance the solubility of a drug, this method was utilized to enhance the solubility of Candesartan Cilexetil. Formulations CC1-CC9 of the SDs of Candesartan Cilexetil, each with a different weight ratio of polymer, were prepared by solvent evaporation method [17]. Though there are numerous methods of preparations of solid dispersions, solvent evaporation is the easiest and safest method to produce solid dispersions for thermolabile drugs where they can easily be converted into more soluble substances without any changes in drug configurations. Solvent evaporation method involves dispersing active ingredients in a hydrophilic inert carrier with the help of a volatile solvent. Here, the solvent possesses low boiling point. Thus, after the dissolution of drug and carrier in an appropriate solvent, the solvent is made to evaporate leaving a residue of drug and carrier owing to formation of solid dispersion. Table 3 lists the drug-to-carrier various ratios. Candesartan Cilexetil therapeutic dose was set to 8mg. Polymer- poloxamer 407 were chosen at 1:1,1:3, and 1:5 ratios i.e. quantity of polymer as 8 mg, 24 mg, and 40 mg. Super disintegrant- croscarmellose was taken at three-levels i.e. 0.5 mg, 1 mg, and 1.5 mg. The appropriate quantities of drug and polymers were taken into conical flasks and adequate amount of solvent is used to dissolve the contents in the conical flask. Solvent used was a mixture of ethanol and acetonitrile. A mechanical stirrer (Remi Pt Ltd., Mumbai) was utilized to properly mix them for one hour at room temperature. Solvent was evaporated under vacuum in a rotating evaporator at a maximum temperature of 50 °C from the resultant solutions. A solid mass is obtained which was then collected and dried at room temperature in a desiccator for 24 hours or until the mixture is moisture-free. The resultant mass is collected and pulverized to form an even mixture. Using FT-IR, SEM analysis, and X-Ray Diffraction studies, dug-carrier incompatibilities were identified if-any and formation of solid dispersions were confirmed.
Characterization of solid dispersions of candesartan cilexetil
FT-IR study
Pure drug with its solid dispersion is examined with the use of SHIMADZU, IRTRACER 100 instrument. Method used to conduct this was potassium bromide disc method. Diffuse reflection and attenuated total reflection are just two examples of the different measurement techniques used in infrared spectroscopy. With the widespread adoption of FT-IR, however, the diffuse reflection technique has emerged as a popular alternative. By applying pressure, alkali halides transform into plastic and form a sheet that is transparent to infrared light, which is a characteristic feature that can be used in this technique. The most prevalent alkali halide used in the pellets is potassium bromide (KBr). The preparation technique for pellets of 13 mm in diameter is detailed below. 200 to 250 mg of fine Kbr halide powder are thoroughly mixed with 0.1 to 1.0% of the sample, which is then finely powdered and added to a pellet-forming die. A vacuum of few mm Hg and a force of around 8 tons are used to create translucent pellets over a period of time. To remove air and moisture from the KBr powder, degassing is done. Pellets that are easily shattered and scatter light may be the result of insufficient vacuum hence pulverize the KBr powder to a maximum of 200 mesh before turning it into pellets. After that, let it dry for two to three hours at about 110 °C. The powder should be stored in a desiccator after drying. High pressure was applied to compress one milligram of sample into every one hundred milligrams of Kbr, and the disc was scanned over a range of 400 to 4000 cm-1 with a resolution of 4 cm-1 using an IR spectrophotometer. Apodization function used was Happ-Genzel.
Powder XRD study
Powder analysis was performed using a (PANalytical, Aeris, Netherlands) continuous scan type instrument. In the incident beam optics, the programmable divergence slit was fixed to 1/4°, the anti-scanner slit is fixed to 1/2°, the fixed incident beam mask is set to 10 mm and solar slits is set to 0.04 radian. In the diffracted beam optics, Prefix module set as PIXcel -Medipix3 1x1 with PASS and anti-scatter slit should match the divergent slit that is 1/4°. Receiving slit is set as none. In Receiving slit the filter is a beta filter nickel. Beam attenuator is set to none. Detector is a scanning line detector (1D). Scan axis used is Gonio. Active length at [2Th.] is 3.3482°. Collimator and mask are set to none. Solar slit is set as 0.04 radian. In X ray generator, tension is set to 40kv and current to 40 milli amps. Empyrean Cu LFF HR (9430 033 7310x) DK41 X-ray tube was used and set to line focus. Sample stage is set to reflection transmission spinner and doors are unlocked and sample is placed in the chamber and is measured.
Scanning electron microscopy
Using FEI Quanta 200, USA scanning electron microscope, surface morphology of samples was determined. A robust device, the Quanta 200 Scanning Electron Microscope can be used to image a variety of samples by operating in either standard high-vacuum or low-vacuum modes. This instrument's electron beam is produced by a typical tungsten filament electron source, which under ideal circumstances can resolve features as small as 3 nm. Accelerating voltage is from 200 V and 30 kV. A small quantity of powder was manually spread onto a carbon sticky pad (double adhesive carbon coated tape), which was attached to an aluminum stub and coated in metal. Samples are examined at different magnifications, photographed, and then the data is captured directly as photos onto a computer.
Formulation of candesartan cilexetil IR component using factorial design
The direct compression method was used to manufacture the tablets. Table 4 demonstrates experimental grid for full factorial design, which consisted of nine experiments in total. The Solid Dispersion-Solvent evaporation technique, was used. Croscarmellose Sodium, magnesium stearate, and aerosol were added to the mixture. Finally, ferric oxide was added to the blend and mixed together uniformly. The blends' bulk density, tapped density, angle of repose, and Carr's compressibility index were measured before compression. Tablet's ultimate weight was 100 mg. Solubility tests, in-vitro dissolution tests, drug content, and % yield were all utilized to assess the solid dispersion's performance.
Formulation of pioglitazone SR granules by Wet granulation method
The SR layer of the drug is 15 mg in therapeutic dose. A total of 6 formulations were designed. Hydroxy Propyl Methyl Cellulose (HPMC), Eudragit and were used as carriers in the preparation of these formulations containing various ratios, as depicted in Table 5. Wet granulation method was employed for granulation. Granulation is a phenomenon wherein small powder particles are brought together to yield granules, which are agglomerates with improved granulation qualities. Powder mixing and the binder's cohesive qualities work together to create granules, which can then be adequately compressed using a tablet press to create tablets with the necessary properties [18]. Drug and carriers were thoroughly triturated in a dry mortar and pestle i.e. Pioglitazone with hydroxy propyl methyl cellulose as P1, P2, and P3 formulations and Pioglitazone with Eudragit as P4, P5, and P6 formulations. An aqueous binder solution with starch was prepared and added with continuous mixing to the powder mixture in mortar to form a dough. This wet mass was passed through mesh no.12 to form even granules and dried. Lubricants magnesium stearate and talc were added to the dry granules mixed thoroughly. Drug-excipient interactions were studied by performing FT-IR studies for pure drug and all the formulations.
Pre‑compression characterization of pioglitazone and candesartan Cilexetil blends
Prior to compression, the flow characteristics of the candesartan and pioglitazone mixtures were assessed using the following metrics: Angle of repose, Carr's index, bulk density, tapered density, and Hausner ratio.
Formulation of bilayered tablet of Candesartan Cilexetil and pioglitazone
Before being reprocessed to create the bilayer tablet, sustained release blend (granules) of pioglitazone was fed into the mold of tablet compressor in a Cadmach rotary tablet machine with 4 mm oval punches. The bilayered tablet was then created by adding and compressing the IR blend of Candesartan Cilexetil. For post-compression evaluation, the optimized IR batch was used to compress all six batches of the SR Pioglitazone layer.
Post-compression evaluation parameters of bilayered tablet
Appearance of tablet: Tablets were inspected manually for their appearance to eliminate tableting flaws like capping, chipping and laminating. Weight variation: 20 tablets were randomly sampled, the average weight was determined, and then they were weighed individually to determine the standard deviation.

Hardness test: Utilizing a tablet hardness tester (Monsanto hardness tester), crushing tests were used to analyze it. The tablet was positioned with faces adjusted between the clamps of the tester, crushed, and the force at point of split was quantified and noted.
Friability test: Ten tablets were selected at random and deposited in the tablet friability testing apparatus' drum (LABINDIA tablet friability tester, FT1020) which was after that configured to whirl 100 times in 4 minutes. The tablets stayed impassive and properly balanced. The percentage of weight reduction was determined.
% F = (1 – Wt / W) ×100
Where, % F represents Friability in% and Wt stands for the weight of tablet after revolution, while W indicates the initial weight of the tablets.
Disintegration test: 6 tablets of each final bilayer tablet batch were taken in a simulated gastric fluid medium on a DURALAB disintegration test apparatus with a water bath of temperature 37 °C and immersions of 30 per minute. The time taken for complete disintegration of each tablet was noted.
Drug content
Accurately weighed and transferred 15 mg of Pioglitazone and 8 mg of Candesartan working Standards into a 50 mL clean dry volumetric flask, add 3rd /4th volume of diluent, sonicated for 5 minutes and make up to the final volume with diluents. 1ml from the above two stock solutions was taken into a 10 mL volumetric flask and made up to 10 mL. Six samples 0.25, 0.5, 0.75,1, 0.25, and 0.5 mL were withdrawn to 10 mL volumetric flasks from standard solution and makeup to final volume with diluent until the final concentrations of Candesartan Cilexetil and pioglitazone were in the range of 4-24 µg/ mL and 7.5-45 µg/mL, respectively. At each concentration level a 10 µl volume was injected into HPLC with the following conditions: mobile phase consisting of 40% acetonitrile and 60% volume of 20 Mm Potassium dihydrogen orthophosphate, a column temperature of 30 °C and a run time of 4.5 minutes at 220nm. Using plot peak area vs. analyte concentration, a calibration curve was obtained. This was replicated for six times. 10 tablets each containing 8 mg of Candesartan Cilexetil and 15 mg of pioglitazone were weighed, powdered and quantity equivalent to total weight of tablet was transferred to a 100 mL volumetric flask and dissolved with diluent. Diluent used contains equal parts of water and acetonitrile (50:50). The solution was filtered and 2 mL each of the filtrate i.e. 16 µg/m L of Candesartan Cilexetil and 30 µg/m L of Pioglitazone was diluted to 10 mL with diluent and analysed. The average weight of a tablet was utilized for drug content estimation.
Release of drugs in vitro
A total of six tablets were studied. U.S. Pharmacopeial Convention Type II Paddle Device studied drug release in vitro from immediate release [19] at temperature 37±.5 °C, 50 rpm, and 0.05 M phosphate buffer of pH 6.5 with polysorbate (0.35%) as a medium was used for the study. 900 ml of dissolution medium was taken and prepared bilayer tablets were examined for 1 hour to study the immediate release of Candesartan Cilexetil. A 10 mL sample was taken at 5-minute interval and the dissolution medium was replenished each time. After an hour, the dissolution medium was changed to pH 7.4 phosphate buffer to study the release pattern of Pioglitazone. Samples were collected for every hour till 8 hours, and for every two hours till 24 hours. Fresh buffer was refilled whenever samples were taken. All the samples were analyzed through HPLC by the method used for drug content estimation. A 0.45 µm membrane filter was used to filter the samples before they were diluted and quantified using HPLC for accuracy in concentration and drug concentrations in the sample were calculated. The experiment was carried out three times. The average values were used because the data was reproducible.
Statistical data analysis
Modeling and analyzing situations in which a particular response is affected by a number of different variables and its goal to optimize it can benefit from the application of the response surface methodology. Based on the factorial design, the run or formulation was tested for its reaction. Multiple regression is used to examine the response data's overall pattern of variation. Analyze the connection between the factor utilized and the resulting response value. Angle of repose and T100 percent were the response values used in this study. Design Expert® 10 software was used to do the multiple regression analysis. F-tests were used to examine the statistical significance of each individual parameter in ANOVA. Each response's polynomial equation was built using the regression coefficient of factor. Data from each factor was analyzed in terms of responses and graphically represented using contour plots and 3D surface plots.
Drug release kinetic modeling
The drug release mechanisms were studied by examining data on dissolution using the Higuchi and Korsmeyer-Peppa, zero-order, and first order equations.
Investigation of accelerated stability
According to ICH requirements, a stability analysis was performed on the optimized batch of bilayered tablets. In a stability chamber (Patel Scientific Instruments) for three months, bilayered tablets with an aluminum foil covering were kept at 40 °C and 75% RH. The tablets' medication concentration, in vitro release, and other physical and chemical properties were then examined.
Results and Discussion
Risk assessment and process attributes
The QbD approach to the pharmaceutical development offers opportunities for more flexible standards, better process understanding, lesser batch failures, more effective and efficient process improvement, increased process understanding leading to more efficient production processes, quicker process development and upscaling, improved clinical outcome quality, and easy transfer of technology. To guarantee a certain level of product quality, risk assessment was carried out using the QbD approach, and high-risk elements which were predicted to have tremendous effect on the formulation were chosen. To define the design space, the significant formulation variables (independent variables) and responses capable of measuring product quality were determined. The concentrations of Poloxamer 407 and Croscarmellose sodium were deemed independent variables for tablet formulations since they were thought to be significant in determining responses i.e. disintegration time and time taken for 100 percent drug release. A 32 factorial design with 9 runs was chosen to investigate the effect of these factors on bilayer tablets. The tablets were made utilizing a solid dispersion process with varying concentrations of polymer and super disintegrant.
Powder properties of formulation blends
Tables 6 and 7 present the results of the pre-compression characteristic for both blends. Bulk density refers to the ratio of mass of bulk powder including the interparticulate void volume. It is an important and essential parameter in solid dosage manufacturing. As it includes the void volume between the particles, bulk density is useful to determine the quantity of powder blend that could fit in a tablet die-cavity and in its hopper or blender. Loosely packed particles tend to have good flow properties. After mechanical tapping of a measuring cylinder containing the bulk powder, tapped density is obtained representing its dense packing without any void spaces. Tapped density is a measure of powder cohesiveness which directly influences the powder flowability. The bulk density and tapped densities for Candesartan Cilexetil ranged from 0.42-0.47 g/cm3 and 0.49-0.54 g/cm3, respectively. For Pioglitazone 0.41-0.44 g/cm3 is the range of bulk density whereas 0.47-0.52 g/cm3 represents the range of tapped density, showing satisfactory packing properties.
Carr's index indicates the compressibility of a powder in turn representing the flowability of bulk solids. It is calculated based on true density and bulk density. A Carr's index of 10 represents excellent flow property whereas a value of 11-15 indicates good flow property. A ratio to the tapped density and bulk density gives the value for Hausner's ratio. Hausner's ratio of approximately 1.0-1.11 indicates excellent flow character and values ranging from 1.12-1.18 indicate good flow character. Carr's index and Hausner's ratio represent the importance of interparticulate interactions. The good flow property is shown by both drug mixtures as for Candesartan Cilexetil the Carr's index had a range of 11.32-12.96 and for Pioglitazone, Carr's index ranged from 12.50-14.58. Hausner's ratio range for Candesartan Cilexetil and Pioglitazone was found to be in the range of 1.12-1.17 which fits the criteria for good flow property. By measuring the angle of repose, the flow characteristics of granules were further studied. The repose angle was performed using fixed funnel method. A glass funnel having 5 mm as its internal diameter was placed over a glass slide at a height of 1 mm through which particles are allowed to flow until the heap of the powder attains a cone shape with its tip reaching the orifice of the funnel. The repose angle is the angle formed by the powder pile's surface and the horizontal plane at which a material can be piled without collapsing. A repose angle with <20° indicates excellent flow property and with 20-30° represents good flow property. All of the mixes of Candesartan Cilexetil and Pioglitazone had an acceptable angle of repose of less than 25° indicating good flow property.
Characterization of pure drug and optimized solid dispersion of candesartan cilexetil
FT-IR study
The measurement mode of a Fourier transform infrared (FT-IR) spectrophotometer is typically set to transmittance or absorbance. However, these spectra are not directly measured by FT-IR equipment. Infrared light from the light source travels along the optical path through a Michelson interferometer during FT-IR analysis.

Three mirrors, a moving mirror, a fixed mirror, and a beam splitter, make up the Michelson interferometer. Before being recombined by the beam splitter, the light beam that the beam splitter divided into two received reflections from the fixed and moving mirrors. The optical path difference to the fixed mirror changes as the moving mirror makes reciprocating movements, causing the phase difference to fluctuate over time. In the Michelson interferometer, the light beams are again joined to create interference light. The optical path difference is recorded along the horizontal axis of an interferogram, which also records the interference light's intensity. An interferogram of the infrared light that travelled through the sample represents the information that was directly recorded by the FT-IR instrument.
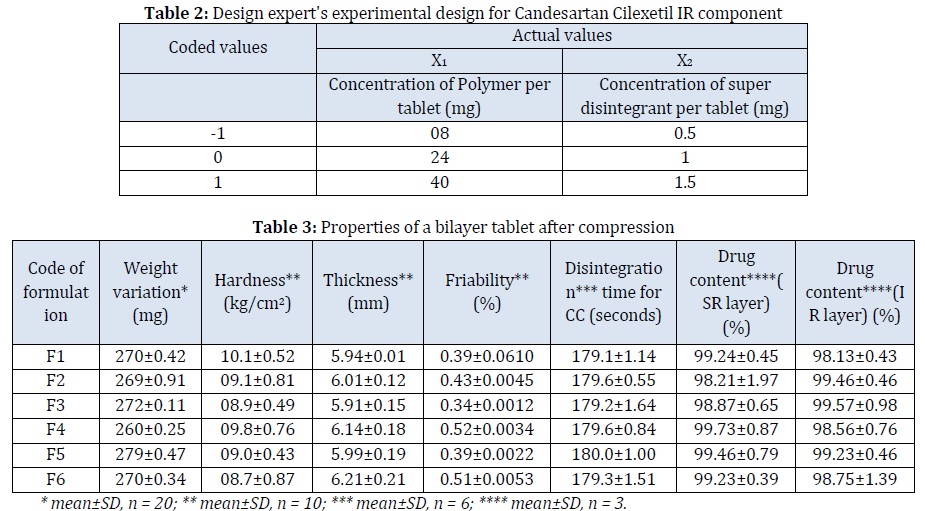
One key feature of the FT-IR device, which measures spectra directly, is the need for Fourier transform by a computer to obtain a normal spectrum with the wavenumber (wavelength) along the horizontal axis. The sample was scanned from 400 to 4000 cm-1. The wavenumber is present in this data along the horizontal axis as needed. Calculating the wave amplitude (intensity) at each interval from the total of all wave periods is known as the Fourier transform. 30 scans were performed for each sample. Resolution was 4 cm-1. Apodization is the process of applying the Fourier transform to the measured interferogram to produce a transmittance spectrum to achieve a proper balance between ripple size and resolution. Hence, the Happ- Genzel function is used for apodization. The integration range is from 0 to infinity. As a result, when the Happ-Genzel function is utilized, the Fourier transform image has a large central peak and well-suppressed ripples. IR Spectrum of Candesartan Cilexetil and its solid dispersion is displayed in Figure 2.
Candesartan Cilexetil shows C-H stretch at 2981 cm-1, a C=O stretch at 1732 cm-1, N-H bending at 1638 cm-1, C-N stretch at 1370 cm-1, CO Ether stretch at 1181 cm-1, and N-H bending at 3968 cm-1, but in the optimized solid dispersion spectra, a shift was observed from 2981 to 2760 cm-1 demonstrating the presence of hydrogen bonding in facilitating solubility.
Powder XRD Study
In the instrument, solar slit comprises of many plates, parallel to each other. The distance between the plates determines the actual acceptance of the x-ray beam. 0.02 is set as the radian in the axial acceptance as it is best for Rietveld refinements and it also improves peak shape and resolution. A Programmable divergence slit, a prefix module for the incident beam side which controls the height of the x-ray beam which in turn determines the length of the sample that is irradiated. Mask controls the sample’s width. 10 masks are used here. The anti-scanner slit reduces background due to x-rays scattering off the air equals to two times of the divergent slit. The sample is placed on the sample stage known as the reflection transmission spinner stage that performs reflection of samples and spinning to bring more crystallites into the x-ray beam.
The size of anti-scatter slit equals to half of programmable divergence slit. A nickel filter is used as it absorbs k ß radiation. Here ideally, we would like a monochromatic x-ray beam, but we have about 3 wavelengths i.e. K α, 1k α 2, and k ß and each one produces its own set of peaks. A nickel filter should be included to get rid of extra wavelengths. This detector is able to collect over 3.3 degrees of 2 theta all at once in a single position so it allows for much quicker data collection with less noise and that comprises of all the optics and the different parts of the standard powder diffraction setup. Candesartan Cilexetil's crystalline and amorphous characteristics were determined using diffraction studies of both the pure drug and solid dispersion.
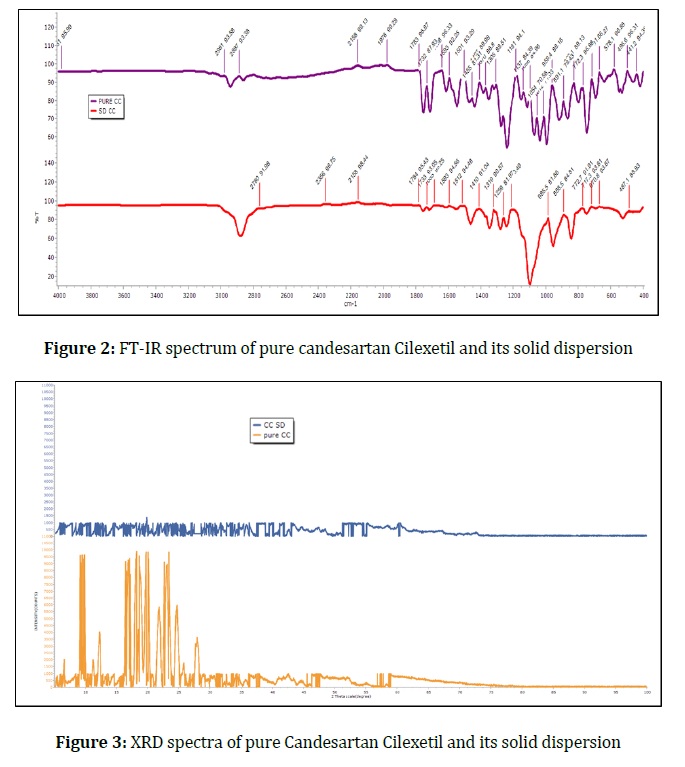
The pure drug spectra exhibit characteristic peaks because of the drug's crystalline form, as depicted in Figure 3, whereas solid dispersion spectra exhibit no prominent identifiable peaks because of its amorphous nature.
Scanning electron microscopy
The Quanta 200 features three vacuum operation modes to handle various sample types. The standard working mode for all scanning electron microscopes is high vacuum (HiVac). The sample should typically be conductive or mounted and coated adequately for conduction to use high vacuum mode. Although coating improves image sharpness and minimizes beam penetration, it could cover up important details for X-ray investigation. Before placing specimens on the specimen stage, the samples are fixed, cleaned, and mounted correctly on the specimen stage. To reduce specimen charging, the specimen was electrically grounded to the sample holder using conductive tape. A Windows-based user interface (UI) program named xT Microscope Control was used to operate the SEM.
The sample is mounted onto the specimen stub, the column, and specimen chamber are vented via the computer interface, and the pin from the specimen mount's underside is inserted into the state’s top entrance. After that, the chamber door is shut and a working pressure that is less than or equal to 5×10⁻⁵ torr is applied. By altering the stage's z-axis, the highest point on the specimen is adjusted at a working distance of approximately 10 mm. The range of the accelerating voltage is from 0 to 30 kV. The image is generated by clicking on the appropriate quadrant, 1, 2, or 3. To get an image with good resolution, the magnifying lens, focus, stigmator, contrast, and brightness are adjusted to the optimum levels. The images of pure drug Candesartan Cilexetil and its solid dispersion are depicted in the Figure 4, which was generated using scanning electron microscopy. Surface morphology findings show that, in pure drug, particles assumed irregular shaped crystals with no uniform size, whereas in solid dispersion, the particles took on a spherical appearance, suggesting that the drug had been integrated into polymer particles. In addition to the XRD spectra, the disappearance of the crystal's uneven morphology lends credence to the latter.
Post‑compression characteristics of bilayer tablet
To avoid processing variables, bilayered tablets were produced in identical batches under the same conditions. Weight variation test would be an acceptable method to determine drug content homogeneity. When the tablets contain 50 mg or more of the drug substance or when the drug substance accounts for 50% or more (by weight) of the dosage form unit, the weight variation test is applicable. According to the Indian and British Pharmacopeial standards, if the total weight of a tablet amounts to 80 mg-250 mg, ±7.5% of the total weight is the maximum difference in weight allowed for a minimum of 18 tablets and ±15% for a maximum of 2 tablets. Here, as the final bilayer tablet weight is 250 mg, 18.75 mg is the weight in deviation allowed for 18 tablets and 37.5 mg deviation is allowed for 2 tablets. As mentioned in Table 3, all tablets for the whole formulations fall within the acceptable range of weight variation.

Hardness also known as crushing strength of a tablet is determined to assess a tablet's breaking point and structural integrity, as well as how it changes throughout storage, shipping, packing, and handling before usage. Hardness of a tablet is measured by positioning the tablet across its diameter between the jaws of a hardness tester. The movable jaw advances towards the tablet forcing it against the other fixed jaw until the tablet crushes under the applied pressure. The load at which the tablet breaks is measured. The oral tablets have a hardness of 4-10 kg. Another attribute that is correlated to the tablet's hardness is friability. The ability of the tablet to endure abrasion during packaging, handling, and shipment is assessed using a friabilator. The friability test's upper and lower bounds cannot both exceed 1.0% which is fulfilled by tablets of all the batches. The observed percentage friability was less than 1.0 percent across all batches. Since thickness affects disintegration and dissolving behavior, a tablet's thickness is essential to its therapeutic efficacy. Furthermore, tablet weight consistency, which is monitored to guarantee dose uniformity, can be determined by the thickness of the tablet. Utilizing a vernier caliper, thickness is measured. Depending on the size of the tablet, the thickness should be kept within a 5% range of a specified value and all batches of tablets fulfill this criterion.
The disintegration test is used to evaluate how quickly a tablet disintegrates into tiny fragments, increasing the surface area and drug availability when ingested by a patient. However, disintegration tests serve as a control tool to check the reproducibility of quality and to determine the potential significance of formulation and process variables on the biopharmaceutical characteristics of the tablet. A basket holding one to six tablets is used to perform the disintegration test on tablets. This is then elevated and lowered into a water-filled beaker to mimic the 37 °C environment of the stomach. The perforated plastic disks are placed on top of floating tablets or capsules to keep them submerged in water. When there is no longer any debris in the mesh, the tablet disintegration time is measured. The disintegration time for the candesartan cilexetil IR tablets was less than 2 minutes, which is significantly less than the USP-recommended maximum disintegration time for uncoated IR tablets (i.e. not more than 15 minutes). Drug content of tablets is measured by the method mentioned above under post-compression evaluation parameters of bilayer tablet. All batches pass the standards for content homogeneity (90-110%). The constructed bilayered tablet appears to have satisfactory handling capabilities based on the hardness test results and % friability values.
In vitro drug release
A crucial test for the development and quality assurance of pharmaceuticals is in vitro dissolution testing. To evaluate the safety, efficacy, and quality of drug delivery systems, an in vitro release investigation is necessary. It is essential for all solid oral dosage forms and is employed during all stages of product development. In vitro drug release is carried out by the above mentioned method. The obtained results were calculated and plotted in Excel sheet to obtain a graphical representation of the results. Compared with nine batches of Candesartan Cilexetil, CC4 containing 1.5 mg of croscarmellose sodium and 40 mg of polymer demonstrated the best drug release of 98.56% within 15 minutes of ingestion as given in Figure 5. As a result, this mixture was chosen to be compacted with six blends of Pioglitazone i.e. finally 6 batches of bilayer tablet were compacted as follows: CC4+P1, CC4+P2, CC4+P3, CC4+P4, CC5+P5, and CC4+P6 and thus obtaining final F1, F2, F3, F4, F5, and F6 batches, respectively. The drug release of Candesartan Cilexetil from immediate release layer is as follows: All the batches released Candesartan Cilexetil in almost the same manner. They reached maximum drug release in 15 minutes and total drug release within 20 minutes.
The release of pioglitazone in the sustained manner from six formulated bilayer tablets is indicated in Figure 6. Six formulations demonstrated release profile based on the concentration of independent factors. HPMC-containing batches F1-F3 exhibit drug release after 20 hours. Formulations F4-F6 containing Eudragit demonstrated required sustained drug release over a 24-hour period. The best-optimized formulation was Formulation F6, containing 45 mg Eudragit per tablet. Thus, from above two drug release profiles, it was found that formulation F6 containing CC4+P6 was the optimized one as the drug release from both the immediate release and sustained release for this batch of formulation fulfills the criteria of immediate release and sustained release. Figure 7 depicts the drug release profile of the optimized bilayer tablet.


Data analysis by design expert software
A 32 full factorial design with three levels of evaluation was chosen. Stat Ease Design Expert software was used to do statistical analysis and data interpretation. To examine the impact of independent factors such as Poloxamer 407 (X1) and Croscarmellose (X2) on dependent variables such as DT (R1) and 100% Drug release (R2), and the 32 complete factorial design was adopted.
Polynomial equation ANOVA analysis and statistical interpretation
Analysis of Variance (ANOVA) is a statistical technique for comparing the means of two or more category groups to see if there is a statistically significant difference between them. There should be at least three levels in the independent variable. As three levels of polymer concentration and super disintegrant concentration was used, ANOVA is applied here. The model F-value which is a theoretical distribution. The ratio of mean squares is the foundation of F statistics. Simply put, "mean squares" refers to an estimation of population variance that takes into consideration the degrees of freedom (DF) utilized to compute that estimate. The F-test evaluates variance equality. F-tests are used to evaluate a regression model's overall significance, evaluate the fit of several models, evaluate particular regression terms, and evaluate mean equality. F-value is calculated by taking the ratio of variation between sample means to variation within the samples. F-value here implies that the model is significant with a p-value of <0.0001. When performing an ANOVA test, the p-value is also based on the F-value. When a hypothesis is tested against observable data, a p-value is employed as a statistical measurement. The null hypothesis that a specific source, model, or parameter is not significant is more consistently rejected the lower the p-value is for a given ratio. The possibility that the null hypothesis is correct is P > 0.05. The p-value is important in the evaluation and interpretation of study results, which are both important aspects. Tables 8 and 9 show the ANOVA for the dependent variables DT and 100 percent drug release, respectively. The coefficients of X1 and X2 were discovered to be significant at p< 0.05, demonstrating that both variables significantly influenced the answers that were chosen. For response 1, predicted and observed R2 were found to be 0.9999 and 0.9997, respectively. For response 2, these values were found to be 0.9998 and 0.9994, respectively. Overall, these factors significantly influenced the response.
A modelling approach with interacting and polynomial terms was employed to assess the responses.
DT = +767.68750-4.79688* qty of poly-553.25000* qty of super dis+0.218750* qty of poly * qty of super dis-0.063477* qty of poly²+232.00000* qty of super dis² - Equation 1
T 100% = +3140.62500-140.07812* qty of poly+38.75000* qty of super dis+27.65625* qty of poly * qty of super dis+1.77734* qty of poly²-615.00000* qty of super dis² - Equation 2
Inferences can also be drawn from polynomial equations using the size of the coefficient and the mathematical sign (positive or negative). Quantity of polymer and quantity of super disintegrant have a substantial impact on DT, as shown by polynomial Equation 2. The bilayered tablet's DT for the immediate release layer decreases, while the concentration of super disintegrants increases, as suggested by the fact that the value for the coefficient is negative for quantity of poly in Equation 2. Combining that quantity of super disintegrant with that of polymer showed positive effect or increase in the disintegration time, while the square of polymer quantity or upon increasing its concentration leads to decrease in disintegration time, but the result was the opposite when quantity of super disintegrant is squared. Quantities of polymer and super disintegrant have a noticeable impact on T 100%, as shown by polynomial Equation 3, while a rise in the response of T 100% is indicated by a positive value for the coefficient of quantity of super dis, Quantity of polymer proposed a negative or decreasing effect on the response. Increasing the quantity of super disintegrant and multiplying the quantity of both super disintegrant and polymer raised a positive effect along with squaring the quantity of polymer but a negative effect was observed when quantity of super disintegrant was observed. The 3D plots in Figure 8a and b how the effects of independent factors on the response tested, such as disintegration time and 100% drug release. The response surface plots in Figure 8c and d showed that different combinations of the independent variables X1 and X2 might satisfy any given requirements (such as the maximum drug release at 15 minutes) while taking different dose form concerns into account.
Method operable design space
The design space is a component of the proposed manufacturing process that not only addresses the controls of important phases and intermediates but also includes a description of the manufacturing process and controls for the manufacturing process. In the design of experiments, the "design space" is a representation of the full spectrum of interactions that can occur between factors and process variables, as well as the effects that these interactions have on critical quality attributes.
This combination and interaction are what makes up the design space. Design space gives desired operational flexibility in terms of scale-independent parameters. It is a combination of the proven acceptable ranges based on experimentation. These interactions have been studied as part of process characterization studies, which are conducted to ensure the quality of pharmaceutical drugs. Figure 9's design space, also known as the overlay plot, depicts the region of successful operating ranges as a yellow-shaded zone. On the x-axis, quantity of polymer- Poloxamer 407 in mg was taken and on y-axis, quantity of super disintegrant- croscarmellose in mg was taken. Design expert calculated the optimum ranges at which the above developed method operates. The optimum middle ground of the experiment can be identified by overlaying critical response graphs on a contour plot. It highlights a spot where all the responses can be met.

Here the acceptable factor setting area for responses DT and T 100% are indicated by the yellow color, whereas the unacceptable factor setting area are given in grey color. Various factors are identified for the same experiment to achieve the nearest or the optimized result. As polymer quantity and super disintegrant quantity is taken at three levels, three spots each an x-axis and y-axis are identified with various experimental conditions but not achieving the desired responses but nearest to the required responses. The concentration of Poloxamer 407- 40mg and croscarmellose-1.5 mg in the design space was found to be critical on responses disintegration time and time required for 100% drug release. In accordance with the quality requirement, the parameters examined for responses were disintegration time of no more than 180 seconds and 100% drug release time of no less than 15 minutes.
Accelerated stability studies
For the optimal formulation, a three-month accelerated stability test was conducted in accordance with ICH requirements. At 0,1, 2, and 3 months, the release profile of the improved formulation was established. The values from the optimized formulation were within tolerable limits and demonstrated good stability, as listed in Table 10.
Conclusion
For the treatment of type 2 diabetes and hypertension, the dose of candesartan cilexetil for immediate release low dose in bilayer tablets was optimized using a factorial design technique as 8 mg. For immediate drug release, poloxamer 407 and croscarmellose solid dispersions were found to be useful and their concentrations in the formulation had significant effect on drug release. The interaction between variables and the degree to which they affect drug release were predicted using the statistical tool design expert trial version 11. Likewise, controlled in vitro drug release is significantly impacted by the concentrations of eudragit and HPMC for sustained pioglitazone release. In conclusion, dual release fixed dose formulation with low dose immediate release anti-hypertensive drug and high dose sustained release anti-diabetic drug was developed which are a great approach to be administered for lifestyle problems like hypertension in fixed dose combinations.
Acknowledgements
The authors are thankful to SRM College of Pharmacy, SRMIST, Kattankulathur, Chennai, Tamil Nadu for providing necessary facilities to carry out this work.
Funding
This research did not receive any specific grant from funding agencies in the public, commercial, or not-for-profit sectors.
Authors' contributions
All authors contributed to data analysis, drafting, and revising of the paper and agreed to be responsible for all the aspects of this work.
Conflict of Interest
The author declared that they have no conflict of interest.
ORCID:
Sangeetha Shanmugasundaram
https://orcid.org/0000-0001-5226-4268
HOW TO CITE THIS ARTICLE
Alyaa Kadhim Mohammed, Ban Al-Drobie, Bashar H. Abdullah. Perineural Invasion in Salivary Gland Carcinomas in Relation to Tumor Grade and Histological Subtypes. J. Med. Chem. Sci., 2023, 6(7) 1517-1536
)