Document Type : Original Article
Authors
1 Department of Electronics and Communications Engineering, M.S. Ramaiah University of Applied Sciences, Bengaluru, India
2 Research Division, Relecura. Inc, Bengaluru, India
Abstract
Kidney has a hierarchy of nephrons on the vascular arteriole tree consisting of nephron groups that interact with neighbourhoods. The kidney modeling approach for the pressure dynamics is complex in mathematical and simulation models for paired and impaired nephrons. CA rules have been developed for multi nephron kidney model from individual nephron CA rules using cumulative algorithm based on additive cellular automata and modular arithmetic. The global emergent properties obtained from CA rules depict the pressure dynamics of the multi-scaled nephron network mode up to ten lakh nephrons, clearly illustrating the nephron’s behaviour that has been captured from the experimental analysis. Regular oscillation as normotensive behaviour and irregular oscillations as hypertensive behaviour have been observed in 30000 and 1000000 nephron network models for different cases. The chaotic oscillations have been observed in the 30000-nephron kidney which leads to chronic kidney disease. Studying the causes and effects of renal diseases due to impairment of nephrons using CA kidney models leads to improvement in the early diagnosis and treatment.
Graphical Abstract
)
Keywords
Introduction
Kidney plays a major role in autoregulation of blood pressure and filtration of toxic elements. Kidney disease is a silent killer as the symptoms can be observed only after the damage of 75% of the nephrons which is an irreversible process and rapidly rising burden in the global health care system. To make the society aware of the kidney diseases and how to detect them early form the major concern for health care professionals and governments.
Mathematical models for kidney physiology fall under the category of cellular, vascular, or tubular modelling. These models are useful in understanding either the individual facets of the kidney’s internal physiology or the whole kidney functionalities. The structural and physiological behaviour of a nephron depends on its internal functioning and interaction with other neighbouring nephrons. The understanding of nephron interactions is essential to analyse the kidney’s behaviour. This leads to the prediction of the functions of the whole kidney physiology. The kidney can be developed as a vascular model and hemodynamic model. Vascular models of the kidney have been used to model transport mechanism and autoregulatory mechanism (myogenic and Tubuloglomerular Feedback (TGF) mechanism). Hemodynamic modeling has been used to investigate the dynamics developed by the interaction between nephrons and also to develop network models [1-4].
Mathematical modelling of the kidney and experimental findings go together for the accurate modelling. Experiments have been conducted on anesthetized rats to investigate the fluctuations in nephron tubular pressures and flows produce interacting regular oscillations, period-doubling, and other chaotic phenomena on 1-nephron and 10-nephron [5, 6]. Mathematical models have been developed for single nephron with auto-regulatory mechanism for rigid tubule and research is ongoing on compliance tubule [7-9]. Lower-level properties of multi-nephrons network models have been modelled in 2-nephron, 8- nephron, 16-nephron, 72-nephron, and 512-nephron models [10-14]. There are few mathematical models which study the dynamical properties of multiple nephrons network in context to autoregulation and solute concentration [15, 16]. After many decades mathematical kidney models of increasing complexity have become an indispensable tool in the effort towards a complete understanding of urine formation, renal autoregulation, and nephrons coupling [17-19]. The developed nephron and kidney models with various computational methods such as finite difference method, network automata, and self-generating graph automata [10-12].
Kidney physiological models are limited in conducting experiments on the kidney for pressure dynamics which requires experimental setup and ethical permissions. Kidney mathematical models have been developed using governing equations limited to 3 nephrons due to its complex phenomena with filtration, diffusion, transport mechanism, and autoregulation. The kidney model, which has ten lakhs nephrons, and their interaction, is highly complicated using governing equations and takes a long path. Kidney simulation models have been developed using graph automata limited to 72 nephrons, which capture only pressure dynamics and solute concentration. Therefore, simulation of the whole kidney model with ten lakh nephrons is required to differentiate normal and abnormal behaviour, which is essential for health care. Currently, there is no model for the whole kidney with ten lakh nephrons.
Many investigators have been working for the modeling of the nephron as well as the whole kidney to understand the pathological and physiological functioning of the kidney. Ideally, the whole kidney model, which has ten lakhs’ nephrons, and their interaction, is highly complicated using governing equations and takes a long path using various computational methods. The functions of nephron interaction and loss of nephron as global properties have been captured in the whole kidney model. The dynamic systems offer a methodology to capture the local and global emergent properties.
The proposed approach is to capture some of the dynamics of the kidney model, which are significant emergent characteristics of the kidney. The cellular automata approach enables capturing global properties with simple local rules. The simulation model has been developed in this investigation to capture global properties for the whole kidney model. The proposed model demonstrated the study of emergent pressure-flow dynamics in multi-nephron systems. The CA rules with various initialization schemes produce different evolutionary patterns equivalent to dynamical class behaviour obtained from experimental and numerical findings. An exploration into the dynamics of multi-nephron systems focused on the whole-kidney model. The dynamics of nephron network kidney systems have been analysed as a system significantly more prominent than existing multi-nephron models. The whole kidney model stability in response to localized impairments in nephron function has been captured. This is the first insight into studying the emergent dynamics of paired (with interaction) and impaired (without interaction) nephron functions. The kidney model illustrates the emergent properties produced by renal diseases have been predicted and analysed.
Cellular automata rules for a kidney
Development of the kidney model starts from a single nephron, nephron-nephron interaction, and multi-nephron network model to reach the whole kidney CA model. Single and coupled nephron model governing equations have to be converted into CA rules. CA rules for multi-nephron network models have to be developed to capture the emergent pressure-flow dynamics.
The governing equations for the single nephron and nephron-nephron interaction have been ultra-discretized using Cole-Hopf transformations and tropical discretization. Cellular Automata rules have been developed based on assumptions for the pressure in the nephron tubule. The CA rules have been developed for the pressure equation with the consideration of the nephron tubule as rigid R(x, t) = constant and compliance R(x, t) = αP (x, t). The cellular automata model parameters values have been calculated from the model parameter values. The CA rule 204 and 254 have been obtained for rigid and compliance tubular model of single nephron, respectively, from Wolfram’s elementary cellular automata rule framework. The CA rule 0 and 255 have been obtained for rigid and compliance tubular model of nephron-nephron interaction, respectively, from Wolfram’s elementary cellular automata rule framework.
The CA rules are derived for the nephron model in sequential manner with increasing complexity. The proposed CA approach can easily scale up the nephron network model from a single nephron to ten lakh nephrons. The complexity comes in the form of framing the interaction rules for CA. The proposed cumulative algorithm using additive cellular automata [20, 21] and modular arithmetic [22] has been developed for getting the CA rules for the n-nephron model based on the various parameters, as displayed in Figure 1.
Figure 1 depicts the linear regression algorithm for obtaining CA rules for the N-nephron kidney model using modular arithmetic. The input parameters for obtaining CA rules are N is the number of nephrons, Nr is the number of rigid nephrons, Nc is the number of compliance nephrons obtained from the difference between total number of nephrons and rigid nephrons Nc = N − Nr. The rigid nephrons have been analyzed for with and without interaction where Nri0 is the number of rigid nephrons without interactions and Nri1 is the number of rigid nephrons with interactions obtained from N ri1 = Nr −N ri0. The compliance nephrons have been analyzed for with and without interaction where Nci0 is the number of compliance nephrons without interactions, Nci1 is the number of compliance nephrons without interactions obtained from Nci1 = Nc − Nci0.
The CA rules for rigid nephron network model without interaction using modular arithmetic is given in Eq. 1.
Ri0_CA_Rule = mod (Nri0 × 204, 256) (1)
The CA rules for rigid nephron network model with interaction using modular arithmetic is given in Eq. 2.
Ri1_CA_Rule = mod (Nri1 × 0, 256) (2)

Figure 1: Flowchart for kidney cellular automata rules
The CA rules for compliance nephron network model without interaction using modular arithmetic is given in Eq. 3.
Ci0_CA_Rule = mod (NCi0 × 254, 256) (3)
The CA rules for compliance nephron network model with interaction using modular arithmetic is given in Eq. 4.
Ci1_CA_Rule = mod (Nci1 × 255, 256) (4)
The CA rule for the N-nephron kidney model has been attained from the addition of CA rules obtained from rigid and compliance CA rules. The kidney CA rules with linear regression and modular arithmetic are obtained from Eq. 5.
Final_CA_Rule = mod ((Ri0_CA_Rule + Ri1_CA_Rule + Ci1_CA_Rule + Ci0_CA_Rule), 256) (5)

The CA rules for 30,000 nephrons kidney which is equivalent to rat kidney that is similar to human kidney and 10,00,000 nephrons kidney which is similar to human kidney have been obtained. Table 1 represents the CA rules and the number of nephrons for a kidney model. The patterns have been analyzed in the following sections.
Results and Discussion
The evolutionary patterns for the CA rules of the 30000- nephron kidney and 1000000-nephron kidney have been analyzed for rigid and compliance tubular with and with-out interaction for five TGF conditions. In the cellular automata, the evolution takes place in a spatio-temporal grid. The origin cell is the left topmost cell. The spatial increment is along the X-axis (towards the right), and the temporal increment is along the Y-axis (towards the down). The dynamic state of cells is represented by white (0) and black (1), where black represents the cell value above the threshold and white represents the cell value below the threshold.
Initialization in CA means assigning black cells in the first rows, i.e. the top row at t = 0. The evolutionary patterns that arrived from the CA rules have been categorized and compared with the Wolfram CA class framework. Feedback means the system response at a current time should influence the current response for future responses. The system response at t depends on the system response of the past. The initialization starts from the second row, and evolution starts from the third row to show the feedback effect. So, any nth row depends on n − 1, n − 2 rows. This is to capture the system response. The present state depends on past states based on the various schemes of feedback conditions. The second row from the top initialization is for the no-feedback case, and the first two-rows initialization is for the TGF case.
The analogy of TGF mechanism in the CA feedback system is described as output response is high if feedback is low, which is equivalent to vasoconstriction at afferent arteriole to regulate pressure for high solute concentration in physiological aspects. The output response is low if feedback is high, equivalent to vasodilation at afferent arteriole to regulate pressure for high solute concentration in physiological aspects. The feedback functionality has been incorporated into the CA evolution system with various feedback conditions depicted in Table 2. Furthermore, these feedback conditions cover the feedback systems that are not covered by governing equations. The evolutionary patterns have analysed the feedback system and its interaction with the CA rules. The feedback conditions have been foreseen in the kidney model, which can be applicable to nephron CA rules. The evolution of CA rules with five feedback system possibilities captures the nephron model's emergent properties that correlate with the experimental findings.

The evolutionary patterns for 30000-Nephron and 1000000-Nephron kidney model have been analysed and correlated with the dynamical class behaviour of Wolfram properties in the following subsections.
30000-Nephron kidney odel rigid tubular model without interaction
The CA rule 64 has been arrived for kidney model which has 30000 nephrons for rigid without interaction and evolutionary patterns have been analysed for various TGF cases.
Figure 2a depicts the pressure variations in which TGF has been inhibited with the F0 and F2 cases. It has been observed that the propagated pulses have vanished. The vanished propagated pulses show that the evolution pattern comes under class 1. Figure 2b depicts the pressure variations in which TGF has been activated with the F1 case. It has been observed that the propagated pulses have vanished. The vanished propagated pulses show that the evolution pattern comes under class 1. Figure 2c depicts the pressure variations in which TGF has been activated with the F2 case. It has been observed that the pulses are propagated in an irregular manner just below the feedback initialization. The irregular propagated pulses reveal that the evolution pattern comes under class 3. Figure 2d depicts the pressure variations in which TGF has been activated with the F4 case. It has been observed that the pulses are propagated in an irregular manner just below the feedback initialization. The irregular propagated pulses show that the evolution pattern comes under class 3.

Figure 2. a) Vanished pulse propagation towards right for alternate 3-cell spacing initialization for F0 and F2 feedback cases, b) Vanished pulse propagation towards right for alternate 3-cell spacing initialization for F2 feedback case, c) Irregular pulse propagation towards right for alternate 3-cell spacing initialization F2 feedback case, d) Irregular pulse propagation towards right for alternate 3-cell spacing initialization for F4 feedback case
The evolutionary patterns for 30000 rigid nephrons without interaction from F0, F1 and F2 cases of TGF activation depict the kidney pressure behavior is normotensive. The behavior of the kidney is normal and healthy conditions. The evolutionary patterns for 30000 rigid nephrons without interaction from F4 case of TGF activation depict the kidney pressure behavior is partially hypertensive. The kidney behaviour is normal and healthy conditions. The evolutionary patterns for 30000 rigid nephrons without interaction from F2 case of TGF condition depicts the irregular and chaotic oscillation which leads to hypertension. In this condition the kidney behaviour is abnormal and unhealthy conditions. The continuous chaotic pressure oscillations in the kidney lead to the causes of kidney diseases. The irregular high-pressure oscillations lead to $26 \%$ of kidney failure. This property leads to chronic kidney failures.
30000-Nephron kidney model rigid tubular model with interaction
The CA rule 0 has been arrived for kidney model which is having 30000 nephrons for rigid with interaction and evolutionary patterns have been analysed for various TGF cases.
Figure 3a depicts the pressure variations in 30000-nephron rigid tubular model with alternate 3-cell gap in the second row. The feedback row (the first row) is initialized with five black cells on the left top in which TGF has been inhibited in this F0 case and TGF has been activated with the F1 and F3 cases. It has been observed that the propagated pulses have vanished. The vanished propagated pulses show that the evolution pattern comes under class 1.

Figure 3: a) Vanishing pulse propagation along with the tubule for alternate 3-cell spacing initialization for $F_0$, $F_1$, and $F_3$ feedback cases, b) Sustained pulse propagation alternatively along with the tubule for alternate 3-cell spacing initialization for $F_2$ feedback case
Figure 3b depicts the pressure variations in 30000-nephron rigid tubular model with alternate 3-cell gap in the second row. The feedback row (the first row) is initialized with five black cells on the left top in which TGF has been activated with the F2 case. It has been observed that the evolution is sustained pulse propagation alternatively along with the tubule. This type of pulse shows that the evolution pattern comes under class 2. Figure 3b depicts the pressure variations in 30000-nephron rigid tubular model with alternate 3-cell gap in the second row. The feedback row (the first row) is initialized with five black cells on the left top in which TGF has been activated with the F4 case. It has been observed that the evolution is sustained pulse propagation alternatively along with the tubule. This type of pulse shows that the evolution pattern comes under class 2.
The evolutionary patterns for 30000 rigid nephrons with interaction from F0, F1, and F3 cases of TGF activation depict the kidney pressure behaviour is normotensive. The kidney behaviour is normal and healthy conditions. The evolutionary patterns for 30000 rigid nephrons with interaction from F4 case of TGF activation depict the kidney pressure behavior is partially hypertensive. The kidney behaviour is normal and healthy conditions. The evolutionary patterns for 30000 rigid nephrons with interaction from F2 case of TGF condition depicts the irregular which leads to hypertension.
30000-Nephron kidney model compliance tubular model without interaction
The CA rule 160 has been arrived for kidney model which has 30000 nephrons for compliance tubular model without interaction and evolutionary patterns have been analysed for various TGF cases.
Figure 4a depicts the pressure variations in which TGF has been inhibited for F0 and TGF has been activated for F1 and F3 feedback cases. It has been observed that the propagated pulses have vanished. The vanished propagated pulses show that the evolution pattern comes under class 1. Figure 4b depicts the pressure variations in which TGF has been activated with the F2 case. It has been observed that the pulses are propagated in an irregular manner just below the feedback initialization. The irregular propagated pulses show that the evolution pattern comes under class 3. Figure 4c depicts the pressure variations in which TGF has been activated with the F4 case. It has been observed that the pulses are propagated in an irregular manner just below the feedback initialization. The irregular propagated pulses show that the evolution pattern comes under class 3.
The evolutionary patterns for 30000 compliance nephrons without interaction from F0, F1, and F3 feedback cases of TGF activation depict the kidney pressure behaviour is normotensive. The behaviour of the kidney is normal and healthy conditions. The evolutionary patterns for 30000 compliance nephrons without interaction from F4 case of TGF activation depict the kidney pressure behavior is partially hypertensive. The kidney behaviour is normal and healthy conditions. The evolutionary patterns for 30000 rigid nephrons with interaction from F2 case of TGF condition depicts the irregular which leads to hypertension.

Figure 4: a) Vanished pulse propagation towards left for alternate 3-cell spacing initialization for F0, F1, and F2 feedback cases, b) Irregular pulse propagation towards right for alternate 3-cell spacing initialization for F3 feedback case
30000-Nephron kidney model compliance tubular model with interaction
The CA rule 208 has been arrived for kidney model which has 30000 nephrons for compliance tubular model with interaction and evolutionary patterns have been analysed for various TGF cases.
Figure 5a depicts the pressure variations in the 30000-nephron compliance tubular model with an alternate 3-cell gap in the second row. The feedback row (first row) is initialized with five black cells on the left top in which TGF has been inhibited with the F0 case. It has been observed that the propagated pulses are in a regular manner. The regular propagated pulses demonstrate that the evolution pattern comes under class 2. Figure 5b depicts the pressure variations in the 30000-nephron compliance tubular model with an alternate 3-cell gap in the second row. The feedback row (first row) is initialized with five black cells on the left top in which TGF has been activated with the F1 case. It has been observed that the propagated pulses have vanished. The vanished propagated pulses show that the evolution pattern comes under class 1. Figure 5c depicts the pressure variations in the 30000-nephron compliance tubular model with an alternate 3-cell gap in the second row. The feedback row (the first row) is initialized with five black cells on the left top in which TGF has been activated with the F2 case. It has been observed that the pulses are propagated in an irregular manner just below the feedback initialization. The irregular propagated pulses show that the evolution pattern comes under class 3.
Figure 5d depicts the pressure variations in the 30000-nephron compliance tubular model with an alternate 3-cell gap in the second row. The feedback row (first row) is initialized with five black cells on the left top in which TGF has been activated with the F3 case. It has been observed that the propagated are in a regular manner. The regular propagated pulses show that the evolution pattern comes under class 1. Figure 5e depicts the pressure variations in the 30000-nephron compliance tubular model with an alternate 3-cell gap in the second row. The feedback row (the first row) is initialized with five black cells on the left top in which TGF has been activated with the F4 case. It has been observed that the pulses are propagated and complete black along the length of the tubule. The complete black propagated pulses show that the evolution pattern comes under class 1
The evolutionary patterns for 30000 compliance nephrons with interaction from F1 case of TGF activation depict the kidney pressure behavior is normotensive. The kidney behaviour is normal and healthy conditions. The evolutionary patterns for 30000 compliance nephrons with interaction from F0 and F3 cases of TGF activation depict the kidney pressure behavior is partially hypertensive. The kidney behaviour is normal and healthy conditions. The evolutionary patterns for 30000 compliance nephrons with interaction from F2 and F4 cases of TGF condition depicts the irregular which leads to hypertension.
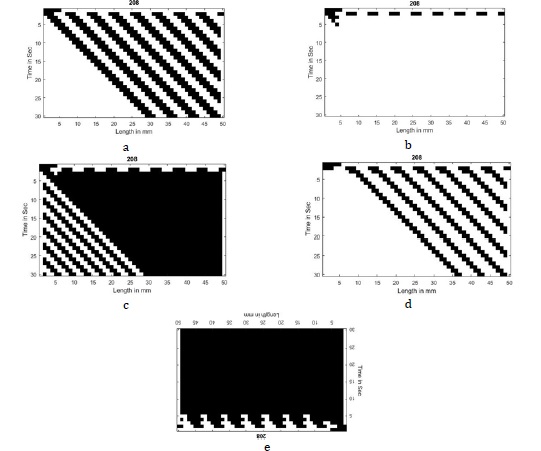
Figure 5: a) Regular pulse propagation towards left for alternate 3-cell spacing initialization for F0 feedback case, b) Vanished pulse propagation towards left for alternate 3-cell spacing initialization for F2 feedback case, c) Irregular pulse propagation towards left for alternate 3-cell spacing initialization for F2 feedback case, d) Vanished pulse propagation towards left for alternate 3-cell spacing initialization for F2 feedback case, e) Complete black pulse propagation towards left for alternate 3-cell spacing initialization for F4 feedback case
1000000-Nephron kidney model rigid tubular model with and without Interaction
The CA rule 0 has been arrived for kidney model which has ten lakh nephrons for rigid tubular model with and without interaction and evolutionary patterns have been analysed for various TGF cases.
Figure 6a depicts the pressure variations in which TGF has been inhibited with the F0 case and TGF has been activated with the F1 and F3 cases. It has been observed that the propagated pulses have vanished. The vanished propagated pulses show that the evolution pattern comes under class 1. Figure 6b depicts the pressure variations in which TGF has been activated with the F2 case. It has been observed that the pulses are propagated in an irregular manner just below the feedback initialization. The irregular propagated pulses show that the evolution pattern comes under class 3. Figure 6c depicts the pressure variations in which TGF has been activated with the F4 case. It has been observed that the pulses are propagated in an irregular manner just below the feedback initialization. The irregular propagated pulses show that the evolution pattern comes under class 3.
The evolutionary patterns for 1000000 rigid nephrons with and without interaction from F0, F1, and F3 cases of TGF activation depict the kidney pressure behavior is normotensive. The kidney behaviour is normal and healthy conditions. The evolutionary patterns for 1000000 rigid nephrons with and without interaction from F4 case of TGF activation depict the kidney pressure behaviour is partially hypertensive. The kidney behaviour is normal and healthy conditions. The evolutionary patterns for 1000000 rigid nephrons with and without interaction from F2 case of TGF condition depicts the irregular which leads to hypertension.

Figure 6: a) Vanished pulse propagation towards right for alternate 3-cell spacing initialization for F0, F2, and
F2 feedback cases, b) Irregular pulse propagation towards right for alternate 3-cell spacing initialization for F2 feedback case, c) Irregular pulse propagation towards right for alternate 3-cell spacing initialization for F4 feedback case
1000000-Nephron kidney model compliance tubular model without interaction
The CA rule 128 has been arrived for kidney model which has ten lakh nephrons for compliance tubular model without interaction and evolutionary patterns have been analysed for various TGF cases.
Figure 7a depicts the pressure variations in which TGF has been inhibited with the F0 case and TGF has been activated with the F1 and F3 cases. It has been observed that the propagated pulses have vanished. The vanished propagated pulses show that the evolution pattern comes under class 1. Figure 7b depicts the pressure variations in which TGF has been activated with the F2 case. It has been observed that the pulses are propagated in an irregular manner just below the feedback initialization. The irregular propagated pulses show that the evolution pattern comes under class 3. Figure 7c depicts the pressure variations in which TGF has been activated with the F4 case. It has been observed that the pulses are propagated in an irregular manner just below the feedback initialization. The irregular propagated pulses show that the evolution pattern comes under class 3.
The evolutionary patterns for 1000000 compliance nephrons without interaction from F0, F1, and F3 cases of TGF activation depict the kidney pressure behavior is normotensive. The kidney behaviour is normal and healthy conditions. The evolutionary patterns for 1000000 compliance nephrons without interaction from F4 case of TGF activation depict the kidney pressure behaviour is partially hypertensive. The kidney behaviour is normal and healthy conditions. The evolutionary patterns for 1000000 compliance nephrons without interaction from F2 case of TGF condition depicts the irregular which leads to hypertension.

Figure 7: a) Vanished pulse propagation towards right for alternate 3-cell spacing initialization for , and feedback cases, b) Irregular pulse propagation towards right for alternate 3-cell spacing initialization for feedback case c) Irregular pulse propagation towards right for alternate 3-cell spacing initialization for feedback case
1000000-Nephron kidney model compliance tubular model with interaction
The CA rule 192 has been arrived for kidney model which has ten lakh nephrons for compliance tubular model with interaction and evolutionary patterns have been analysed for various TGF cases.
Figure 8a depicts the pressure variations in which TGF has been inhibited with the F0 case and TGF has been activated with the F1 and F3 cases. It has been observed that the propagated pulses have vanished. The vanished propagated pulses show that the evolution pattern comes under class 1. Figure 8b depicts the pressure variations in which TGF has been activated with the F2 case. It has been observed that the pulses are propagated in an irregular manner just below the feedback initialization. The irregular propagated pulses show that the evolution pattern comes under class 3. Figure 8c depicts the pressure variations in which TGF has been activated with the F4 case. It has been observed that the pulses are propagated in an irregular manner just below the feedback initialization. The irregular propagated pulses show that the evolution pattern comes under class 3.

Figure 8: a) Vanished pulse propagation towards right for alternate 3-cell spacing initialization for F0, F2, and F3 feedback cases, b) Irregular pulse propagation towards right for alternate 3-cell spacing initialization for F2 feedback case, c) Irregular pulse propagation towards right for alternate 3-cell spacing initialization for F4 feedback case
The evolutionary patterns for 1000000 compliance nephrons with interaction from F0, F1, and F3 cases of TGF activation depict the kidney pressure behavior is normotensive. The behavior of the kidney is normal and healthy conditions. The evolutionary patterns for 1000000 compliance nephrons with interaction from F4 case of TGF activation depict the kidney pressure behaviour is partially hypertensive. The behaviour of the kidney is normal and healthy conditions. The evolutionary patterns for 1000000 compliance nephrons with interaction from F2 case of TGF condition depicts the irregular which leads to hypertension.

Figure 9: Classification of evolutionary pattern configurations
Exemplar configurations of Evolutionary patterns are shown in Figure 9. All figures have been configured in four quadrants based on the evolutionary patterns. In the quadrant of low generative diversity and high robustness, we observe a transition from normal patterns to normotensive patterns to slightly above normotensive patterns. Evolutionary patterns are analogous to slightly above normotensive show configurations densely populated with uniform and solid domains of cells in 1 or 0. The evolutionary patterns interpreted as normotensive evolve to fixed all-1 or all-0 global states \cite{martinez2013note} \cite{adamatzky2013creativity}. In the quadrant of low generative diversity and low robustness, a transition from slightly above normotensive patterns to partially hypertensive patterns have been observed. In the quadrant of high generative diversity and high robustness a transition from partially hypertensive patterns to hypertensive patterns have been observed. The chaotic evolutionary pattern observed in 30000 nephrons rigid tubular without interacting kidney populates the quadrant of high generative diversity and low robustness corresponding to the end stage of renal disease or chronic kidney disease under F2 TGF condition. The human kidney with 1000000 nephrons for rigid and compliance model exhibits the normotensive behaviour in all the TGF cases except for F2 case with and without interaction between nephrons. The hypertensive behavior has been observed in the F2 TGF condition.
The emergent properties captured from the cellular automata kidney model illustrate the nephron behaviour that has been captured from the experimental analysis. The developed cellular automata kidney model has been mimicking the kidney’s functionality from experimental findings under various pathological and physiological conditions. The CA modeling approach and result analysing techniques have been presented to capture the global emergent dynamics to study the whole kidney system. In addition, this work has been demonstrated for the first time to simulate the renal function of whole kidney dynamics using individual nephrons properties.
Conclusion
The CA approach has the capability to identify the emerging global behaviour of the whole kidney dynamics. The unique CA modeling approach has been proposed, and the results have been analysed to show valid behaviour. CA rules have been developed for multi-scale nephrons up to ten lakhs nephrons using a cumulative algorithm based on additive cellular automata and modular arithmetic. The study of global emergent dynamics in the whole kidney system for rat (30000 nephrons) and human (1000000 nephrons) has been demonstrated. The behaviour of the interconnected nephron changing from normotensive to hypertensive and vice versa in evolutionary patterns has been explicitly captured, which is correlated with the physiological conditions for various TGF conditions in both rat and human kidney. The rat kidney exhibits chronic kidney disease for rigid tubular impaired nephrons. The emergent properties have been captured in the whole kidney model in both normal and abnormal conditions. The CA modeling approach helps in identification of early-stage renal disease.
Funding
This research did not receive any specific grant from funding agencies in the public, commercial, or not-for-profit sectors.
Authors' contributions
All authors contributed to data analysis, drafting, and revising of the paper and agreed to be responsible for all the aspects of this work.
Conflict of Interest
The author declared that they have no conflict of interest.
ORCID:
Siva Manohar Reddy Kesu
https://www.orcid.org/0000-0003-1947-4364
Christy Bobby T
https://www.orcid.org/0000-0002-7691-8120
Hariharan Ramasangu
https://www.orcid.org/0000-0002-7590-1749
HOW TO CITE THIS ARTICLE
Siva Manohar Reddy Kesu, Christy Bobby T, Hariharan Ramasangu, Pressure Flow Dynamics in Kidney Model Using Cellular Automata Rules. J. Med. Chem. Sci., 2023, 6(6) 1276-1290
)