Document Type : Original Article
Authors
1 Department of Chemistry, College of Science for Women, University of Baghdad, Iraq
2 Department of chemistry, College of science for Women, University of Baghdad, Iraq
Abstract
Antibiotic resistance has been a growing worldwide public health issue. The World Health Organization (WHO) has stated that the search for new antibiotics is slow, while antibiotic resistance is growing. WHO has also declared that antibiotic resistance is one of the top 10 global public health threats facing humanity in the 21st century. Therefore, this review discusses the potential of metal-based drugs as antibacterial agents from the period of the early 2000s to date. The review reveals that a lot of preliminary work has been done to assess these as potential drugs. However, their mode of action is faintly described. Furthermore, a few examples of metal-based drugs assessed for their modes of action are described. These compounds are ideal as they have been observed to work with one or more modes of action and they are also able to induce or increase activity of free organic compounds once bound to the metal. Nonetheless, more studies are needed to understand the modes of action of other transition metal compounds.
Graphical Abstract
)
Keywords
Introduction
Azomethine chemistry has become an appealing field for researchers due to the flexibility and efficacy of the azomethine group (C=N). It has entered all fields since the scientist Hugo Schiff reported on the azomethine compounds attended by the condensation of aldehydes and ketones with primary amines [1].
Schiff's base is frequently applied in various branches of chemistry, including analytical, inorganic, and organic chemistry. As a result, Schiff base applications have become one of the widest domains that enjoy continuity and innovation to generate more appealing outcomes. It has also become a significant addition to improve the performance of polymers, adhesives, and dyes [2,3]. It has been stated that using Schiff's bases as a material helps to stabilize polymers and other materials and resistance to harmful rays, including ultraviolet rays, which lead to damage to polymeric structures that may be subject to cracking and the formation of free radicals, thus accelerating the damage. Due to the importance of polymers and the multiplicity of fields in which they are used [4], the interest in studying and developing this field has become especially important among other fields. Previous studies showed the preparation of Schiff bases and their thermally stable metal complexes (5,6) that were added to polymers to prevent degradation and treat discoloration and cracking, reducing surface tension and treating mechanical defects. Schiff bases have been further used to design sensors and catalysts and in the installation of bio-lubricant and lighting additives, in addition to other pharmacological and biological uses, including antibiotics, analgesics, anti-inflammatory, antiviral, antipyretic, anti-proliferative, antimalarial, antioxidant, and antitumor agents [7-9].
Materials and Methods
All reagents and chemicals used in this study were in the analytical grade and purchased from (Sigma-Aldrich). 2-hydroxy naphthaldehyde 99%, 4-amino antipyrine 98%, ethylene di-amine 99%, MnCl2.2H2O 99%, NiCl2.6H2O 99%, CuCl2.2H2O 99%, CoCl2.6H2O 99%, and ZnCl2 98% were provided from BDH and used as received.
Instrumentation
Infrared spectra of bonds and their complexes were recorded within the range of (200- 4000) cm-1 by using a device of type (Shimadzu FTIR-Spectrometer) and by using disk (KBr) for bonds and (CsI) for complexes at University of Baghdad, College of Science, Department of Chemistry. Magnetic sensitivity was measured by John Mathey device, England at Al-Nahrain University, Chemistry department.
The 1H-NMR spectra of the as-prepared bond were recorded by using a Bruker 300 MHz AVANCE spectrometer with DMSO as solvent at room temperature (Tehran), and the mass spectra of the prepared compounds were recorded by a GC-Mass-Agilent 5975c instrument for the studied ligand and the compounds by using the (ElementerVari) instrument in (Shahid Beheshti University in Tehran, the Islamic Republic of Iran.
The melting point of the prepared ligand and its complexes were measured by using a (SMP10) device from the English company, Stuart, at the temperature range of 300 °C, the molar conductivity was measured with a WTW meter and the UV-visible spectra in the range 190.00-1100 nm were measured by using Shimadzu UV-Vis device, ultraviolet spectrophotometer A 160. The prepared solutions were at a concentration of (1×10⁻³ molar) in dimethylformamide (DMF) solvent in the Department of Chemistry, College of Science for Girls, University of Baghdad.
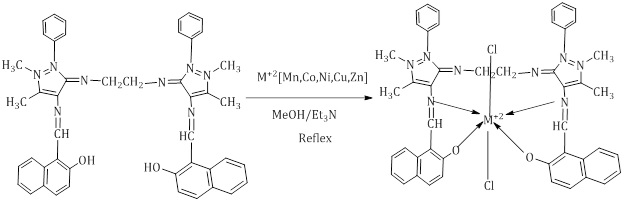
Synthesis of ligand A1
A1 Schiff base is prepared in two steps, as follow:
The first step; preparing LH1 substrate
In a flat bottom circular glass flask (50 mL), LH1 was prepared by condensing 2-hydroxy-1-naphthaldehyde with 4-amino anti pyrin in a 1:1 ratio. 1 g (0.0058 mol) of 2-hydroxy-1-naphthaldehyde was added and dissolved in 20 ml of the pure ethanol solvent with simple stirring to complete the dissolution process, 2 drops of glacial acetic acid are added, followed by gradual addition (1.18 g or 0058 mol) of 4-aminoantipyrine and it was left for 4 hours until the reaction was complete with the formation of a solid precipitate. The mixture was allowed to cool at room temperature, and then filtered and dried at 50 °C (Scheme 1).

Scheme 1: Preparation of the base material of LH1
The second step; A1 Preparation
In flat bottom round glass flask (50 ml), 1 g of LH1 substrate was added and dissolved in 15 ml of pure ethanol. Then, with simple stirring to complete the dissolution process, two drops of glacial acetic acid were added to it, followed by the gradual addition of 0.0868 g (0.00134 mol) of ethylene diamine. After that, the mixture was heated with simple stirring for 7 hours until a solid precipitate was formed; the precipitate was filtered and dried at 50 °C. Then, the product was recrystallized with pure ethanol (Scheme 2).
Preparation of metal complexes A1 ligand complexes
In a 25 mL flat bottom circular glass flask, 0.1 g (0.000135 mol) of ligand A1 was added to 15 mL of pure methanol with heating and slight stirring to complete dissolution. Followed by adding the equivalent weight of salt according to the weights shown in Tables 1 and 2, it was dissolved in 5 ml of the pure methanol. The mixture was left for 5 hours in the reflux reaction until a colored precipitate indicated complex formation was formed. Next, the reaction was stopped and the product was allowed to cool at room temperature, and then the precipitate was filtered and washed with clean cold water, and after that, it was dried by ether. The product was filtered and dried at 50 °C (Scheme 3).
Scheme 2: Preparation of A1 ligand

Scheme 3: Preparation of A1complexes
Table 1. The equivalent weights of the salts
|
Quantity in grams |
Mwt. for salt |
Salt formula |
Complex symbol |
|
0.0267 |
197.90 |
MnCl2.4H2O |
A1+Mn |
|
0.0321 |
237.93 |
CoCl2.6H2O |
A1+Co |
|
0.0320 |
237.69 |
Ni Cl2. 6H2O |
A1+Ni |
|
0.0229 |
170.48 |
Cu Cl2. 2H2O |
A1+Cu |
|
0.0184 |
136.29 |
Zn Cl2 |
A1+Zn |
Table 2: Physical characteristics of chemical compounds
|
Compound |
Molecular formula |
Yield (%) |
Elemental analysis data |
Conductivity |
Melting point |
Mwt. |
Color |
||
|
C% |
H% |
N% |
|||||||
|
LH1
|
C22H19N3O
|
85 |
73.93) (77.40) |
5.63 (5.108) |
11.76 (11.71) |
--- |
212-214 |
357.43 |
Goldenrod |
|
A1 |
C46H42N8O2 |
67.96 |
73.56 (74.77) |
5.277 (5.73) |
11.66 15.17 |
---- |
Des. |
739 |
yellow |
|
A1+Mn |
C46H40MnN8O2Cl2 |
48 |
62.90 (64.04) |
3.989 (4.67) |
13.64 (12.99) |
33.2 |
>300 |
863 |
sage |
|
A1+Co |
C46H40CoN8O2Cl2 |
62.4 |
62.87 (63.75) |
4.621 (4.65) |
.62 (12.93) |
10.7 |
>300 |
867 |
sangria |
|
A1+Ni |
C46H40NiN8O2Cl2 |
63 |
62.87 (63.76) |
3.969 (4.65) |
11.64 (12.93) |
4.0 |
>300 |
867 |
Sea green |
|
A1+Cu |
C46H40CuN8O2Cl2 |
75.6
|
62.77 (63.41) |
3.969 (4.63) |
11.71 (12.86) |
5.3 |
>300 |
871 |
Dark khaki |
|
A1+Zn |
C46H40ZnN8O2Cl2 |
66.35 |
62.87 (63.28) |
3.806 (4.62) |
11.65 (12.83) |
3.0 |
>300 |
873 |
yellow |
Results and Discussion
FT-IR spectrum of A1 Ligand
By comparing the FTIR spectrum of ligand A1 and the base materials, which were both LH1 and ethylenediamine, ligand A1 was identified by the disappearance of some bands and the appearance of new peaks by tracing the LH1 spectrum. The strong C=O group absorption peak was disappeared in the 1643 (s) region, and the evolution of the imine group was indicated by the appearance of an average absorption peak in the 1637.58 (m) region of the A1 spectrum (C=N). With the hydrazide ring in LH1, the O-H hydroxyl group in the LH1 complex kept its frequency almost in position and it had a slight change in the shape of the absorption peak and shifted to a slightly higher frequency from (3450) to (3452.58) cm-1 and this explained the new conformation for the ligament problem [10,11].
FT-IR spectrum of A1 complexes
By comparing the infrared spectra of the complexes with the spectrum of ligand A1, a significant difference was found between them, as the bands disappeared, or shifted to other frequencies, and new bands appeared that were not present in the A1 ligand spectrum, and the changes can be summarized as follows: (C=N) group: The new bands indicate conversion of the (C=N) group in ligand A1 from 1643 cm-1 into new bands. Aromatic Hydroxyl Group: The frequency of the hydroxyl group appeared in the form of a wide peak in the region 3450, 3452 cm-1 for the base material and for the A1 bond, respectively, while it fades, or shrinks and turns into larger bands, which is an indication of the oxygen group linkage with metal ion bands. At the same time, new ranges were appeared in the area between 250-600 cm-1 (Table 3). These bands belong to the formation of bonds (M-O), (M-N), and (M-Cl) to confirm the formation of complexes Figures S1-S7 [12-14].
Table 3: FT-IR spectral data of the synthesized chemicals (cm-1)
|
Compound |
M-OH2 |
C=N |
C=C |
C-H |
M-O |
M-N |
M-Cl |
|
|
stretch |
bending |
|||||||
|
|
|
|
|
2899 |
1303.88 |
|
|
|
|
LH1 |
3450.65 |
1643.35 |
1570 |
3066 |
1350 |
---- |
------ |
----- |
|
A1 |
3452.58 |
1637.56 |
1543.05 |
3059.1 |
1334.74 |
----- |
------ |
------ |
|
A1+Mn |
3475.73 |
1606.70 |
1539.2 |
3001.24 |
1340.53 |
501.49 576.72 |
424.34 445.56 |
262-343 |
|
A1+Co |
3456.44 |
1639.49 |
1543 |
3034 |
1354 |
516.92570.93 |
424.34 459 |
266-333 |
|
A1+Ni |
3489.23 |
1614.42 |
1539.2 |
3059 |
1340 |
538 596 |
430 459 |
266-333 |
|
A1+Cu |
3468 |
1625.99 |
1544 |
2879 |
1359.82 |
516.92-570.93 |
424-459 |
266.18 333.69 |
1H-NMR Spectrum
The 1H-NMR spectrum of ligand A1 demonstrated a number of signals, as displayed in the following Figure S8. The following signals are attributed to impurities appeared after displacement (σ = 3.83 ppm. 3H+:CH3). The following signal was appeared after displacement. It can be attributed to the protons of the methyl group attached to the nitrogen atom in the pyrazole ring (σ = 8.97 ppm, 3 H+: CH3), the methyl group attached to the nitrogen atom has a lower frequency due to its union with an atom with higher electronegativity than carbon, which leads to its displacement to high-frequency region, a signal appeared with a displacement of (σ= 4 ppm, S, 4H+: CH2 = CH2). By applying the rule for (neighboring protons+1), each group is assumed to have three signals. The reason for the appearance of one signal is the symmetry of compound A1. The following signs were appeared at a displacement between (8.10-7.6) ppm, namely: (σ = 7.6-8.10 ppm, 22H +), which is a doubling of the signal attributed to the benzene ring protons and naphthaldehyde protons, where the benzene ring is expected to give three signals from the origin of five protons (5H+), while the two naphthaldehyde rings are expected to give seven signals, six signals attributed to the C-H ring protons were appeared after displacement (σ=10.56-10.62 ppm, 2H+:N=CH) and can be attributed to two hydrogen atoms (N = C-H). The appearance of one signal was due to the double bands for the symmetry of the A1 molecule. Two signals were appeared after displacement (13.78-13.95 ppm) which can be attributed to the protonation of the two hydroxyl groups connected to the naphthaldehyde rings (σ = 13.78-13.95 ppm, 2H +, 2OH) [15,16].
Mass Spectrum
The mass spectrometry of LH1 illustrated the ratio of mass to charge, (M/Z+ . Mwt=357), which is identical to theoretically calculated molecular weight of the compound. Figure S9 displays the mass spectrum of compound LH1.
Mass Spectrum of Ligand A1
The data values were tracked to measure the mass spectrometry of ligand A1 and it appeared several times with 739, 738, and 737 values which are fit to the compound ligand A1 and it is equal to 100% of the weight of the compound identical to what was calculated theoretically 739. Figure S10 illustrates this, as the mass spectrometry measurements showed the ratio of mass to charge equal to (M/Z+. Mwt=368). This value is approximately equal to half of the molecular weight of ligand A1. Through the above scheme, we find that the ligand is divided into two equal parts by mass; approximately each part equals 368.2 g/mol, which represents 50% of ligand A1. Two molecules of the LH1 compound are linked to two equivalent parts by heterogeneous fission. One of the two molecules retains the electron pair and will, in turn, be unstable and tend to combine with positive parts. As for the second part carrying the positive charge, whose peak appeared or the mass-to-charge ratio is equal to (M/Z+. Mwt = 368.2), it will go through several stages of losing parts of its structure, so the best peak was 368.2 corresponding to (C22H19N4O) M+, which is equal to 50% of the weight of the compound, the next peak which is the best (Base peak) of the M/Z ion is equal to 184.2 which corresponds to the M+ ion (C11H11N3) which is equal to 24.9% of the weight of the compound. The next peak was the M/Z ratio equal to 170, which corresponds to the ion (C11H11N2) M+, which is equal to 23%. The next peak was the M/Z ratio equal to 127, which corresponds to the M+ ion (C9H5N2), which is equal to 17.18% of the weight of the compound, the next peak was the mass-to-charge ratio equal to 101, which corresponds to the C8H5N+ion (which equals 13.6). The next peak was the M/Z ratio of 86, which corresponds to the C7H2) M+ ion, as equivalent to 11.9. The last peak was the M/Z ratio of 50, which corresponds to the C5H2) M+ ion, which equals 6.76% [17].
UV Spectrum
Following the electronic spectrum of ligand, we found the appearance of three electron beams (230, 275, and 380) of which three transitions are represented in Table 4. The electronic spectra of the following complexes showed cobalt complex. The spectrum of cobalt compound indicated three bands (1075, 740, and 366) nm, which represent the allowable transitions and their magnetic moment was equal to (4.54). This corresponds to the magnetic moment of the hexagonal complexes, which is within the octahedron 4T1g (F) → 4T2g (F), and ʋ1 4T2g (F) → T1g (P) ʋ3 nickel complex. Nickel complex demonstrated three (933, 883, and 468) nm bands, which represent three transitions 3A2g (F) → 3T2g (F ʋ1, 3A2g (F) → 3T1g (F) ʋ2, and 3A2g (F) → 3T1g (p) ʋ3, while the value of the magnetic moment was equal (2.59), which corresponds to the hexagons copper complex. The spectrum of copper complex showed a wide range in the regions (649, 444, and 247) nm, which represents three combined transitions, and its magnetic moment is equal to (1.71) and it is further within the hexagonal. For Zn and Mn complexes, we do not expect transitions to occur because their outer shell is stable through saturation or semi-saturation, respectively, and the appeared bands listed in Table 4 represent the bonding spectra or charge transfer spectra. Through the infrared spectrum with molar conductivity measurements, we can suggest the shape of their complexes [18,19].
Table 4: The electronic spectral data of ligand and its metal complexes (nm)
|
The geometry of the compound |
µeff. |
Transition type |
Transition Peak |
Compound |
|
nm |
||||
|
--------------- |
------- |
*π→π *π→π n→π* |
230 275 380 |
A1 Ligand |
|
OCT |
4.9 |
Charge transfer |
408 321 263 |
A1+Mn |
|
OCT |
4.54 |
4T1g(F)→4T2g(F) ʋ1 4T2g(F)→T1g(P)ʋ3 Charge transfer |
1075 740 366 |
A1+Co |
|
OCT |
2.59 |
3A2g(F) → 3T2g(F)ʋ1 ʋ1 3A2g(F)→3T1g(F) ʋ2 3A2g(F)→3T1g(p) ʋ3 |
933 483 468 |
A1+Ni |
|
OCT |
1.71 |
2B1g→ 2A1g 2B1g→ 2Eg Charge transfer |
649 440 247 |
A1+Cu |
|
Dia |
----- |
Charge transfer |
426 305 |
A1+Zn |
Thermogravimetric Analysis (TGA)
The reaction was carried out from 40 °C to 800 °C at a rate of about 10 degrees per minute. Thermal weight loss (TGA) in an atmosphere of air indicated that the curve of the ligand and its mineral compounds was correct, going through stages of weight loss. It was noted that the compounds of this group, which include the ligand and its complexes, are characterized by a high thermal stability. Furthermore, thermal analysis proved the absence of water molecules in the composition of this group, the following scheme reveals the stages of weight Figures S11-S13 (Table 5) [20].
Biological activity
It was noted that the results of the effectiveness of Lycand A1 and its complexes were very effective against fungi The fungus (Candida albicans) and its effectiveness ranged with bacteria, where the zinc complex [Zn(A1)Cl2]H2O was characterized in inhibiting the growth of gram-positive bacteria Staphylococcus aureus, while the cobalt complex was characterized with A1 [Co(A1)Cl2]H2O In inhibiting the growth of Gram-negative bacteria Klebsiella pneumoniae In general, the activity of the A1 complexes was more effective and is specialized against the fungus Candida and then against gram-positive bacteria. It is mentioned that these bacteria cause skin diseases and cause inflammation of wounds (Figures 1, 2).
Table 5: Stages of fragmentation of the ligand and its complexes by TGA analysis
|
Product |
%Weight loss |
Average temperatures |
No. |
|
|
Found |
calculate |
|||
|
C24H26N8 |
57.7 |
57.7 |
280-380 |
A1 I |
|
C11H8O |
21.3 |
21.2 |
380-490 |
II |
|
C11H8O |
21 |
21 |
490-740 |
III |
|
|
0.0 |
0.0 |
Residue |
|
|
C22H22N8Cl2 |
53.6 |
54.15 |
375-480 |
A1+Ni I |
|
C2H12 |
29.4 |
29.09 |
480-600 |
II |
|
C4H6NiO2 |
16.74 |
17 |
>600 |
III |
|
|
0.26 |
0.24 |
Residue |
|
|
C18H14N8Cl2 |
47 |
47.3 |
370-340 |
A1+Zn I |
|
C21H26 |
32.2 |
31.84 |
450-370 |
II |
|
C7ZnO2 |
20.2 |
20.7 |
800-450 |
III |
|
|
0.6 |
0.16 |
Residue |
|
Table 6: Biological activity of ligand A1 and its complexes
|
Compounds
|
The diameter of the test area is recorded in )mm( |
|||||
|
|
Bacterial |
Fungi |
||||
|
|
Gram postive |
Gram Negative |
||||
|
No. |
Staphyloc oCcus aureus |
Klebsiella pneumoniae |
Compounds |
No. |
Candida albicans |
|
|
Solvent DMF |
8 |
negative |
negative |
Solvent DMF |
8 |
20 |
|
Ligand A1 |
9 |
15 |
15 |
Ligand A1 |
9 |
22 |
|
[Mn(A1)Cl2]H2O |
11 |
15 |
16 |
[Mn(A1) Cl2]H2O |
11 |
21 |
|
[Co(A1)Cl2]H2O |
14 |
16 |
20 |
[Co(A1) Cl2]H2O |
14 |
22 |
|
[Ni(A1) Cl2]H2O |
12 |
16 |
13 |
[Ni(A1) Cl2]H2O |
12 |
22 |
|
[Cu(A1) Cl2]H2O |
13 |
16 |
15 |
[Cu(A1) Cl2]H2O |
13 |
21 |
|
[Zn(A1) Cl2]H2O |
10 |
20 |
16 |
[Zn(A1) |
10 |
22 |
|
Standard |
|
4.32a |
4.32a |
|
|
20.41b |
MIC minimum inhibitory concentration (10-2 M)
aof oxacin
bFluconazole

Figure 1: The diameters of the antibacterial activity of the ligand and the inhibitory area of its metal complex
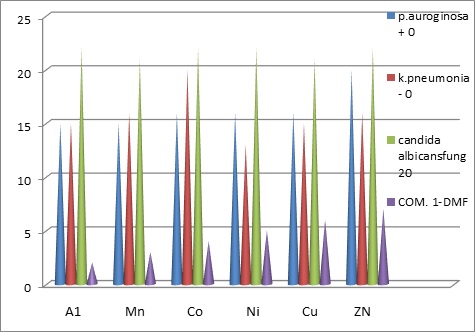
Figure 2: shows the distribution by activity of ligand A1 and its complexes in DMF
Conclusion
The Schiff symmetric base A1 and its complexes were successfully prepared and the prepared compounds were diagnosed by analytical and spectroscopic methods. The results of the gravimetric analysis(C H N) and infrared spectroscopy showed the validity of the composition of the compounds and the electronic transitions showed their geometric shapes. It also showed that the A1 ligand behaves like a four-claw ligand. We believe this is the reason for the high stability of the compounds. This was embodied in the TGA analysis, where the compounds are characterized by a high stability of up to 400 degrees Celsius, so we suggest these compounds as additives for stabilization and to increase the resistance of products against thermal decomposition, The biological activity of the compounds was also studied and compared with other antibiotics, and the results of the study indicated that the prepared compounds had a moderate to high activity relative to the antibiotic used for comparison, so the metal complexes showed an increased activity that exceeded that of the ligand A1.
Acknowledgment
I would like to extend my thanks and appreciation to the Department of Chemistry at the College of Science for Women, University of Baghdad.
Funding
This research did not receive any specific grant from funding agencies in the public, commercial, or not-for-profit sectors.
Authors' contributions
All authors contributed to data analysis, drafting, and revising of the paper and agreed to be responsible for all the aspects of this work.
Conflict of Interest
There are no conflicts of interest in this study.
ORCID:
Bushra Mohan
https://orcid.org/0000-0003-1599-0476
Supporting Information
Additional supporting information related to this article can be found, in the online version, at 10.26655/JMCHEMSCI.2023.2.16
HOW TO CITE THIS ARTICLE
Bushra Mohan, Naser Shaalan, Highly Thermally Stable and Biologically Active Compounds Prepared To Be Polymer Stabilizers Consisting Of a Schiff Base and Its Complexes Derived From 2-Hydroxynaphthaldehyde, J. Med. Chem. Sci., 2023, 6(2) 355-364
)