Document Type : Original Article
Authors
1 Department of Physiology, College of Medicine, Misan University, Iraq
2 Department of physics, College of Science, University of Diyala, Iraq
3 Department of physics, College of Science, Mustansiriyah University, Iraq
Abstract
In this pepar, the effect of concentration on the fluorescence and absorption spectra of Eosin yin (ethanol, methanol, and DMF) atconcentrations [1×10⁻⁴M] and [1×10⁻⁵M] was studied. The exctation wavelength of ethanol and methanol was (510 nm), the exctation wavelength of N,N-Dimethylformamide was (530 nm), and some optical parameters such as the absoption wavelength and fluorescence in the UV-Vis and some graphic relationships were measured such as the relationships between the dielectric constant, orientation polarizability (Δf), and the refractive index.
Graphical Abstract
)
Keywords
Introduction
Caffeine in acid solution quenches fluorescence of polycyclic hydrocarbons; while in neutral solution, it quenches fluorescence of riboflavin, and intensifies of thiochrome, mepacrine, and eosin [1].
The fluorescence wavelength and the solvent intensity effect may be influenced by a solvent transition, but the change is always unpredictable. When studying the solvent effect, three things; namely, the pureness of solvents, non-aqueous solvents, and aquatic solvents were analysed [1].
They stain the most parts with bright fields. The eosin of red blood cells showed heavy bleeding of hemalum and eosin eosinophil leucocyte granules, relatively heavy muscle fiber staining, liver cytoplasm, and some other epithelial cells and slightly less intense collagen fiber [2].
The elastic fibers glow green. Thus, it is difficult to tell what color the red blood cells actually were that seemed yellow-orange [2]. Fluorescence is dependent on the intensity of excitation radiation. If three or more applications are applied simultaneously, illumination goes up exponentially [2]. Eosin Y in water the quantum yield is (0.2) and for eosin Y in methanol is= 0.4 [3] measuring the absorption rate of solution A and solution B and studying dyes effect. Eosin (Eosin Y, sodictetrabromofluorescein) was superior than the other sensitive dyes tested [4]. Fluorescence spectrum exhibited a red change compared with the excitation radiation in ordinary temperature conditions and in condensed media. The efficiency of vibrational relief contributed to a loss of energy before fluorescent emissions and made a red shift, called a stokes shift more normal [5]. In brief, fluorescent H & Estained microscopy Slides are quickly and easy to perform. It can provide useful information in certain settings fast and without the associated time delay for special stain [6].
Although the adsorption was not drastically affected by the tank’s pH, the quantity of the adsorbed eosin Y decreased significantly when pH reached over pH = 8 [7].
For experimental data for the eosin, in this analysis, we have compared the isothermal chitosan balance with those for the isothermal models of Langmuir and Freundlich [7]. The major novel finding of this study is that it looked at both histochemical and immunohistochemical methods to determine pathology. It gave the first ever cancer in which we had not identified the vascular invasion as colorectal cancer. Specifically highlighting the endothelium improves the likelihood of tumor metastasis. It is merely hematoxylin and eosin [8]. In the experiments, Brilliant Sulfaflavine tracer (BSF), Pyrannine, Fluorescein, Tinopal,and Eosin were selected [9].
Comparatively, the weak fluorescence of Eosin-base yellow was tested. The cargo resistant capability of micellar media was increased in combination with the cationic and anionic materials [10]. Eosin is a xanthene. It is a tracer dye [11].
The absorptive and fluorescent strength are increased when solvents are applied to the aqueous solution of Eosin Y (EY). It is found that alkanols influenced dye absorption and fluorescence [11].
Different mechanisms can be used to screen for biophysical systems and to extensive applications. In this article, you will find the results of the interaction parameters of the Eosin Y (EY) color molecule, although allied studies on the physicochemical behavior of various dyes are found in the literature were presented in solvent and inorganic salts [11].
In a watery solution, Eosin Y has a maximum absorption at 520 nm and the maximum emission at 560 nm [11]. A significant category of laser dyes is xanthene dyes which is employed as an active medium for many laser dyes [11]. The EY observations in the solvent presence can be explained on the basis of solvent adsorption [11].
The EY excitation and fluorescence spectrums have provided quantitable details about the competitive linkage of alkanols with tent in alkanol and aqua-alkanol media [11].
The photocatalysis function of eosin Y does not have at this point, it was investigated in depth [12]. The researchers explored the verapmil effects, along with verapamil hydrochloride on the fluorescence, resonance, and absorption Rayleigh scattering spectra [13]. The findings that came out were of verapamil. Hydrochloride reacted gradually with eosin to create these materials for a rise in dye concentration [13]. This analysis shows that it is quite structured. Similarly, the photophysics of EB and EY are very different and the dynamics of the excited state. This discrepancy is because of the character charge-transfer of EB status, S1 introduced the existence instead of Bromine atoms of two nitro groups. This increased electronic density which on optical groups, awakening hydrogen bonds accompanies a protic solvents [14].
The spectral variations between the dyes indicate that the emitting condition of is very different to EY. the first state occupied I can allocate that to the EB nitro groups magnificent property for the retraction of electron [14].
EB's spectrum of ACN vs. protic solvents including water and alcohol is substantially different. It has an extreme band of around 425 nm, which should be because of a second, non-emissive dye form because it is absent from the fluorescent spectrum excitation reported at 600 nm [14]. Wth concentration increases, this fluorescence range is subject to drastic changes, with the slight raise in concentration causing a little decrease in intensity of solution, while the maximum eosin wavelength increases at a high concentration, where dimmer is sensitive, at the high concentration for solution. The increase in the maximum wavelength is because the concentration is very low, and these differences are observed through the increase in the output dilute solution of monomer [15]. As concentration of dye increases in methanol, the shift in wavelength in ultraviolet becomes considerable [15]. We know that when one mixes the anionic dye with positively charged chitosan-capped nanoparticles, the anionic dye molecule attracts the positively charged nanoparticles [16].
Thus, we could conclude that quenching isn’t effective in eosin dye. A reduce in emission and absorption spectra is mainly caused by a reduction in eosin catalysis by synthesized nanoparticles [16].
Eosin is a monomeric fluorescent dye. There are important differences in the response spectra of the AuNPs dye [16].
The only catalyst used is eosin y which is the visible exciter. This wavelength (400 to 700 nm) may cause a photocatalytic reaction [17].
Eosin y is a red coloring material used as a histological coloring agent (i.e. eosin staining and hematoxylin) [17].
This most likely happens because the higher light attenuation results from red pigment of Eosin y [17]. Application of thermal lens in spectroscopy to examine the absorption and optical bleaching of optical physics processes in organic dyes. It is an attractive tool for studying changes in optical properties when the thermal, optical and chemical properties of eosin y change [18]. The work was performed on the thermal lens at various temp from 21 °C to 41 °C in distilled water and 43.5 nm.
When the data for eosin y and ethyl eosin were analyzed, it became apparent that the estimation increased the value of Φf and τf to the red shift in λem and λabs [19].
By using the optimal wavelength and response time, the intensity of fluorescence was accurately measured in the sample [19].
The solvent water exhibits a significant effect that reduces both f and f. The results were demonstrated for eosin, erythrocin, and fluorescein in a range of solvents [19].
As a photocatalyst, Eosin y, is a commonly used substance in synthetic chemistry. Due to some beneficial reasons, there are better chances to use Eosin Y as a photocatalyst [20]. In photolysis reactions, Eosin y plays a mediating role. In stoichiometric amounts of electron receptors, the reactions mentioned include the degradation of thiamides and antioxidants [20]. The pH level of hematoxylin and eosin is critical because accurate results will be achieved that look up the product details or company's protection datasheet before use [21]. Alcohol-based disinfectants are added to dry the tissue portion and prepare the slide for post-coverage eosin staining. Post-stain rinses improve the staining power of eosin by removing excess eosin from tissue parts [21]. Molecular fluorescence lays out complex topics in an easy-to-understand way [22]. Eosin can limit the solar cell performance because eosin has very absorption spectrum that extends only to 700 nanometers [23]. A chemically treated dye mixture, containing water, and ethanol dissolved in eosin, was examined to see how the performance of the solar cells might be affected by an enhance in the sintering temperature [23].
Eosin y exhibits very strong absorption at short wavelength range. At 522 nanometers (nm), which corresponds to the highest absorption peak of the Eosin y monomer [24].
The sample dye accompanied the sintering approach with the largest efficiency among other dyes as eosin y [24]. The use of a xanthine group of dyes provides a fluorescent study with insight into their electronic and photochemical properties [25]. The excited system will likely re-radiate the light emitted from the miniature system. With increased energy, relaxation rate increases in the case of excitement [25]. This may have a consequence in investigating the relaxation spectra of EY and EYM anions due to their differing behaviors as phosphorescence markers [25]. Dyes include organic synthetic chemicals mimic the natural ability of the pigments to absorb the substrate content and provide color. The organic substances naturally attach to the substrate surface resulting in color appearing on the surface of the material [26]. The chemical group xanthene is put into three categories according to the form of the category. There are three types of structural fluorones as: fluorescein, erythrosine, and rhodamine [26].
Eosin is an acidic, red orange-pink dye which is very good for staining. Eosin staining has been the most widely used process in histopathology and seldom enters the key dissection rooms [26].
Eosin is an ion-pairing agent that can interact with several drug molecules to form a colored/fluorescent binary. We can study them without extraction by spectrofluorometry methods [26]. Several are widely available xanthene. It has been commonly in use in the research of lots for pharmaceuticals [26].
A red dye belonging to the xantane group of dyes, eosin y, has been commonly used for the determination of certain forms of drugs by forming ionic complexes with these substances when assayed by spectrophotometry and/or spectrofluorometry [26].
The stable and fluorescent activity of the ion pair complexes were measured in unique solutions, and they distributed them in the water. The pH is assumed to be the important factor that plays an important role in ionization of eosin y [26]. It is found that CMI or AMI combines dye may lead to the quenching of the dye. It established a fluorescent cooling method for determining CMI and AMI for pharmaceutical materials [27].
It caused the fluorescent cooling of the EY. Various reactions may occur such as excited-state reactions, complex formation, energy transfer, and collision suppression [27].
This ion interaction complex among EY and drug allows the second-order Resonance Rayleigh scatter spectrum to appear at a wavelength of 620 nm [27]. The initial eosin concentrations may also cause light wave attenuations and changes in penetration depth. In addition, there is an optimum set of reaction conditions where there would be a maximum conversion of input to output [28]. It performs research to find out the impact of light strength, reaction temperature, reagent volume, and other factors on the degradation rate of the dye eosin [28]. Thermodynamically, the electrochemical requirements in the eosin y -hydrolytic operation have restricted the application of chemical eosin y [29].
Laser tunes and modes are used for modifying in carceration and Q- switching [30].
In eosin y, the acidic xanthine pigment is mainly used in foods and biological coloring. Various techniques have developed for the benefit of this dye in quantifying many pharmaceuticals, heavy metals, some solvents, and proteins [31]. Although it is still very effective under ideal conditions, the synthetic dye Eosin Yellow (EY) is usually weakened by the surrounding environment [32]. The more sensitive, fluorescence spectroscopy was done with EY at the polar end of the fluorophore's surrounding medium [32].
Single and double chain metallosurfactants' conductivity measurements were performed in EY solution to observe how single and double chain metallosurfactants interact with metallosurfactant monomers [32].
Experimental
Materials
Eosin yellow (CAS 17372-87-1) is an eosin organic coumpond with a chemical formula of (C20H6Br4O5Na2) and its molecular weight is 691.855) g/mol and a tetrabromofluorescein, disodium salt [33].
Eosin Y isafluorescentred dye laser. Eosin was dissolved in (methanol, ethanol, and N,N-Dimethylformamide) prepared at different concentrations [1×10⁻⁴ M] and [1×10⁻⁵ M]. The chemical structure of Eosin y dye is displayed in Figure 1.

Figure 1: The chemical structure of eosin y dye [26]
Using solvents to dissolve the eosin material
Ethanol (C2H6O) [33]
It is a polar solvent used for dissolving the (eosin). The molecular weight is (46.068 g/mol), the dielectric constant is (25.3), the melting point is (-114.14 °C), boiling point is (78.29 °C), and the refractive index is (1.3611).
Methanol (CH4O) [33]
It is a polar solvent used for dissolving the Fluorescein. The molecular weight is (32.042 g/mol), the dielectric constant is (33.62), the melting point (–97.53 °C), the boiling point is (64.6 °C), and the refractive index is (1.3288).
N,N-Dimethylformamide HCON (CH3)2 [33]
The molecular weight is (73.09 g/mol), the dielectric constant is (38.25), the melting point is (-61 °C), the boiling point is (153 °C), and the refractive index is (1.4305).
Fluorescence measurement
Fluorescence emission was measured from prepared the samples at the section by using spectrofluorophotometer type of (RF-5301pc Shimadzu). The samplewere mounted cubic cell of quartz dimensions (1 × 1 × 5) cm3 at angle (90 °C) with incident beam. The purpose of this optical geometry was to reduce the effect of dispersed incident light and to reduce the phenomena of inner filter effect. The equipment was computerized and worked in the 220-900 nm wavelength range. The fluorometer was equipped by a specialized computer that controls experimental operations (excitation and emission wavelengths, monochromator slit width, scan, and detector parameter) as well as spectral data acquisition. This study included the exciting wavelength for (ethanol and methanol, λmax=510 nm). The exciting wavelength for DMF (λmax=530nm) was choosed in themeasurements and used slit width of excitation and emission (λex=1.5 nm), (λmax=3 nm) were used. The measurements were taken with the photomultiplier at the same sensitivity.
Preparation of Dye Solution
The dye solutions is prepared of different concentrations and dissolving from given material to be studied in given volume of solvent used in the preparation and the material is weighted according to the following relation:
W
Where,
W: The weight of material in (g).
M.W: Molecular weight (g/mol).
[M]: Molar concentration (mol/L).
V: The volume of solvent used to dissolve the material in (mL).
The prepared solutions were diluted according to the following equation:
[M]1V1 = [M]2V2
Where,
[M]1: Primary concentration.
[M]2: New concentration.
V1: The volume of solution before dilution.
V2: The volume of solution after dilution.
Results and discussion
In this paper, fluorescence spectra of eosin solution were dissolved in three solvents with concentration [1×10⁻⁴ M] and [1×10⁻⁵ M] that were measured the exciting wavelength (λex= 510 nm in ethanol and methanol). The exciting wavelength was (λex= 530 nm in DMF).
Figures (2 and 3) depict the absorption spectrum for eosin y in three solvents at concentration [1×10⁻⁴ M] and the absorption spectrum for eosin y in three solvents at concentration [1x10⁻⁵ M] that indicated the absorption spectra for eosin y, which they consisted of one peak, it was found that the absorbance intensity for these peak are increased in (ethanol, methanol, and DMF) at [1×10⁻⁴ M] comparatively with [1×10⁻⁵ M].
Because the absorbance is proportional to the solution concentration, the concentration also increases, the bsorbance is increased, so the absorbance intensity at the concentration [1×10⁻⁴M] was greater than the absorbance intensity at the concentration [1×10⁻⁵ M] according to Beer-Lambert low that increases in the solvent concentration result in increasing number of molecules in solution and that this will then result in the of the optical density.

Figure 2: Absorption spectrum for eosin y in three solvents at concentration [1×10⁻⁴ M]
The amount of the absorbed light does not depend on the intensity of the incident light. Rather, it is reduced in equal proportions and there is an increase towards the long wavelength (red shift) with an increase in the solvents polarity, as is evident. Also, the absorbance of the molecular compound varies from one solvent to another at a certain wavelength. The reason is the difference in the absorption coefficient of the substance, which depends on the type of solvent.

Figure 3: Absorption spectrum for eosin y in three solvent at concentration [1×10⁻⁵ M]
In Figures (4 and 5), the fluorescence spectra to eosin dissolved in different solvent at concentration [1x10⁻⁴M] and the fluorescence spectra to eosin dissolved in different solvent at concentration [1x10⁻⁵M] shows the fluorescence spectra of eosin y solution, which they are consist of one peak. It is found that the fluorescence intensity for these peaks are increased with increases in the solvent polarity in (ethanol, methanol, and DMF) at concentrations [10-4 M] and [10-5M], as represented in Tables (1 and 2) for fluorescence's intensity parameter for eosin y in (ethanol, methanol, and DMF) and its spectrum parameter for eosin y in (ethanol, methanol, and DMF).
Table 1: Fluorescence's intensity parameter for eosin y in (ethanol, methanol, and DMF)
|
Solvent |
Peak of fluorescence's intensity (a.u) at concentration [1×10⁻⁴ M]. |
Peak of wavelength to fluorescence's spectrum (nm) at concentration [1×10⁻⁴ M]. |
|
Ethanol |
73.9 |
555 |
|
Methanol |
102.8 |
559 |
|
DMF |
125 |
569 |
Table 2: Fluorescence's spectrum parameter for eosin y in (ethanol, methanol, and DMF)
|
Solvent |
Peak of fluorescence's intensity (a.u) at concentration [1×10⁻⁵ M]. |
Peak of wavelength to fluorescence's spectrum (nm) at concentration [1×10⁻⁵ M]. |
|
Ethanol |
560 |
549 |
|
Methanol |
567 |
546 |
|
DMF |
717 |
560 |

Figure 4: The fluorescence spectra to eosin dissolved in different solvent at concentration [1x10⁻⁴M]

Figure 5: The fluorescence spectra to eosin dissolved in different solvent at concentration [1x10⁻⁵M].
From Figures (4 and 5), it is observed that the fluorescence spectra to eosin dissolved in different solvent at concentration [1x10⁻⁴ M] and the fluorescence spectra to eosin dissolved in different solvent at concentration[1x10⁻⁵ M] can be observed as the solvent polarity increases, the fluorescence spectrum intensity increases in (ethanol, methanol, and DMF) solution at [1x10⁻⁴ M] and [1x10⁻⁵ M] where a dipole-dipole creaction occurred between the solute-solvent particles which is interpreted as a decrease in the level of the electron excited state. Therefore, the energy gap of the ground state to the excited state (s1s0) is minimal, while the non-radiative processes on the process rate (IC) will be increased. Thus, the dipole moment of this molecule increases because of the relaxation process to solvent molecules during the excited state in contrast to the ground state, the polarizing force also increased [34].
In Figures (4 and 5), the fluorescence spectra to eosin dissolved in different solvent at concentration [1x10⁻⁴M] and the fluorescence spectra to eosin dissolved in different solvent at concentration [1x10⁻⁵ M] illustrate this effect, when the polarity was increased the peaks of the fluorescence spectra are be shifted towards to the longer wavelength .This shift value dependent on the dielectric constant (ε) of solvent and on the difference between the dipole moment of solute molecule in ground and excited state [35].
The decrease in the peaks intensity with increased of concentration is caused by the phenomenon of self-absorption of emitted photon before leaving the solution by the molecules in the ground state, as shown in Figures (4 and 5). The fluorescence spectra to eosin dissolved in different solvent at concentration [1x10⁻⁴ M] and its spectra to eosin dissolved in different solvent at concentration [1x10⁻⁵ M].
Figure 6 demonstrates the comparative intensity of emission spectra of each Eosin y in solvent solution at concentrations at [1x10⁻⁴ M] and [1x10⁻⁵ M] and illustrates this effect as well as the intensity of the fluorescence spectrum for solutions of concentration at [1x10⁻⁴ M] decreases significantly for solvents with eosin compared with the fluorescence spectrum. Figure 6 indicates the comparative intensity of emission spectra of each Eosin y in solvent solution at concentrations at [1x10⁻⁴ M] and [1x10⁻⁵ M] for the same for solvents at concentration [1x10⁻⁵ M]. The reason is known that the self-absorption phenomenon increases in the solutions of high concentrations.

Figure 6: Comparative intensity of emission spectra of each Eosin y in solvent solution at concentrationsat [1x10⁻⁴M] and [1x10⁻⁵M]
The increase in the fluorescence spectrum towards the long wavelength (red shift) of eosin y in the solvents at the concentrations [1x10⁻⁴ M] and [1x10⁻⁵ M], as the dielectric constant of the solvent increases (except for methanol, it decreases at [1x10⁻⁵ M]) explains the presence of a greater electric dipole moment in the excited state than in the groundstate thereby leads to an interaction between the electric dipole moment of the solute molecule and the solvent polarity, this results in an increase in the dissolving energy of the solvent molecule and an increase in the stability of the excited level with a decrease in the energy value of the excitation state which appears as a shift towards the long wavelength. In this case, we can see that the fluorescent spectrum shifted to longer wavelengths when the polarities were increased. The shift value is affected by the dielectric constant (ε) value of the solvent and the difference between the dipole moment values of the solvent [35].
Figures (7a, 7b, and 7c) show the absorption and emission spectra of Eosin in methanol at concentration [1x10⁻⁴M], absorption and emission spectra of Eosin in ethanol at concentration [1x10⁻⁴M], and absorption and emission spectra of Eosin in DMF at concentration [1x10⁻⁴M] for the absorption and emission spectra of eosin y solution were dissolved in (ethanol, methanol, and DMF) at concentration [1x10⁻⁴M], respectively, the absorption spectrum of eosin y in ethanol, which consist of on peak , is located at (510 nm), the emission specrt consists of one peak that is located at wavelength (λem=555 nm), the absorption spectrum of eosin y in methanol, which consist of on peak , is located at (510 nm), the emission specrt consists of one peak that is located at wavelength (λem=559 nm), the absorption spectrum of eosin y in DMF, which consist of on peak is located at (522 nm), the emission specrt consists of one peak that is located at wavelength (λem=569 nm).
Table 3: Orientation polarizability(Δf), refractive index (n), and dielectric constant (ε) of Eosin y concentration of a molecule dissolved in various solutions atconcentrations of [1x10⁻⁴M] and [1x10⁻⁵M]
|
Solvent |
Orientationpolarizability (Δf) |
Dielectric constant(ε) |
Refractive index( n) |
|
Ethanol |
0.2899 |
25.3 |
1.3611 |
|
Methanol |
0.3091 |
33.62 |
1.3288 |
|
DMF |
0.2756 |
38.25 |
1.4295 |

Figure 7: (a, b) Absorption and emission spectra of Eosin in methanol at concentration [1x10⁻⁴ M] (c): absorption and emission spectra of Eosin in DMF at concentration [1x10⁻⁴ M]

Figure 8: (a) Absorption and emission spectra (b): Absorption and emission spectra of Eosinin ethanol at concentration [1x10⁻⁵ M], Eosin in methanol at concentration [1x10⁻⁵ M]
Figures (8a, 8b, and 8c) reveal the absorption and emission spectra of Eosin in ethanol at concentration [1x10⁻⁵ M], absorption, and emission spectra of Eosin in methanol at concentration [1x10⁻⁵ M] and absorption and emission spectra of Eosin in DMF at concentration [1x10⁻⁵ M] shows the absorption and emission spectra of eosin y solution were dissolved in (ethanol, methanol, and DMF) at concentration [1x10⁻⁵ M], respectively, the absorption spectrum of Eosin y in ethanol, which consist of on peak, is located at (525 nm), the emission specrt consists of one peak located at wavelength (λem=549 nm), the absorption spectrum of eosin y in methanol, which consist of on peak, is located at (523 nm), the emission specrt consists of one peak located at wavelength (λem=546 nm), the absorption spectrum of eosin y in DMF, which consist of one peak, is located at (536 nm), the emission specrt consists of one peak located at wavelength (λem=560 nm ).
The decrease in the peaks intensity with increased concentration is caused by the phenomenon of self-absorption of the emitted photon before leaving the solution by molecules in the ground state, as illustrated in the above figure.
Figure 6 depicts the comparative intensity of emission spectra of each Eosin y in a solvent solution at concentrations [1x10⁻⁴ M] and [1x10⁻⁵ M] that illustrate the emission spectrum for (ethanol, methanol, and DMF) with at concentration [1x10⁻⁵ M] at aconsists of one peak located at wavelength (549 nm) in ethanol, (546 nm) in methanol and (560 nm) in DMF, respectively. For the fluorescence peak, it is observed that there is a shift toward the longer wavelength with increases in the solvent polarity.

Figure 9: The relation between dielectric constant (ε) and orientation polarizability (Δf) of Eosin y concentration of a molecule dissolved in various solutions [1x10⁻⁴M] and [1x10⁻⁵M]
Also, Figure (9) indicates the relation between dielectric constant (ε) and orientation polarizability (Δf) of Eosin y concentration of a molecule dissolved in various solutions [1x10⁻⁴M] and [1x10⁻⁵M] shows that the Orientation polarizability (Δf) increase with dielectric constant (ε) increase, except DMF so as it increases the orientation polarizability with decreases in the refractive index, thus decreases at dielectric constant value, the orientation polarizability increases, and as Figure (10) demonstrates, the relation between orientation polarizability (Δf) and the refractive index (n) of Eosin y concentration of a molecule dissolved in various solutions [1x10⁻⁴M] and [1x10⁻⁵M].

Figure 10: The relation between orientation polarizability (Δf) and refractive index (n) of Eosin y concentration of a molecule dissolved in various solutions [1x10⁻⁴ M] and [1x10⁻⁵ M]
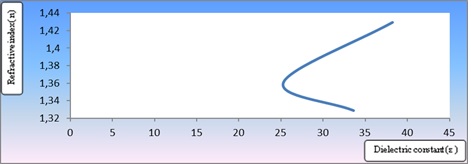
Figure 11: The relation between dielectric constant (ε) and refractive index (n) of Eosin y concentration of a molecule dissolved in a variety of solutions [1x10⁻⁴ M], and [1x10⁻⁵ M]
Conclusion
In this research, it was notable that an increase in the fluorescence wavelength with an increase in the solvent polarity at the same concentration of Eosin Y expect for methanol is reduced when the concentration decreases.
The fluorescence wavelength increases by increasing the concentration at each polar solvent used in this research, because the red shift to the wavelength used for vilot light. It is worth to note that the fluorescence intensity of Eosin Y increased when the used solvent polarity increasd and an increase in the intensity of the reduced concentration.
Funding
This research did not receive any specific grant from fundig agencies in the public, commercial, or not-for-profit sectors.
Authors' contributions
All authors contributed to data analysis, drafting, and revising of the paper and agreed to be responsible for all the aspects of this work.
Conflict of Interest
The author declared that they have no conflict of interest.
HOW TO CITE THIS ARTICLE
Waleed Khalid Hamood Al-Behadili, Yaqoob M. Jawad, Waleed S. Abdul Whaab. Effect of Solvent on Intensity of Absorption and Florescence of Eosin Y Dye and Spectral Properties of Eosin Y Dye. J. Med. Chem. Sci., 2023, 6(2) 322-334
)