Document Type : Original Article (Special Issue)
Author
Market Research and Consumer Protection Center, University of Baghdad, Iraq
Abstract
The greatest dangerous trichothecene generated through Fusarium spp., mainly F. sporotrichioides, is T-2 toxin. T-2 toxin is an environmental pollutant that really can cause a considerable illnesses and even death in humans and animals. It can be found in a range of farm products. The goal of the current study was to use high-performance liquid chromatography (HPLC) to analyze T-2 mycotoxin in cereal samples that contained (≥1ppm). This is Iraq's first HPLC-based T-2 toxin analysis investigation. Baghdad City's local markets took a total of 20 commonly produced cereal product tests and rated them. T-2 toxin presented for 40% of cereal products, with the greatest amount identified in a sample of flour corn was 1.9 ppm. In comparison with the volume of produced specimens, the incidence of toxin-contaminated specimens is not very low.
Graphical Abstract
)
Keywords
Introduction
The Fusarium genus, which was discovered by the scientist Link in 1806, is considered as one of the economically important fungal species, as it includes many species that are pathogenic to humans, plants, and domestic animals, and some of its types have the ability to produce many secondary metabolic substances known as mycotoxins such as Beauverici, Fumonisins, Fusaproliferrin, Moniliformin, and Zearalenone [1-2]. Annually, the proportion of grain contaminated with mycotoxins is 25-50% worldwide [3]. The genus of Fusarium spp. is found in most parts of the world, especially in plant remains, in soil, or within plant tissue, but species belonging to this genus may be more specific in their distribution, as some of them have a global geographical distribution, such as (F. compactum, F. dimerum, F. semitectum, F. sporotrichioides) and they are determined by tropical and semi-tropical regions or cold or warm, temperate, and cold regions, while other genera are determined by vegetation such as F. graminearum [4-5]. This fungus is characterized by its wide range as it causes many diseases in various agricultural crops and grains, such as head blight, which is caused by the aforementioned fungus which destroys the wheat plant, which is the most effective type of mushroom on grain crops, as well as infects humans and animals through eating foods, agricultural crops, and grains contaminated with mycotoxins [6]. The growth of the fungus Fusarium spp. is affected by changing of environmental conditions such as pH, temperature, humidity, and the type of nutrient medium, since the optimum temperature for fungus growth is from 25-28°C [7]. T2 mycotoxin is considered as a major concern in the contamination of agricultural crops, the most important of which are grains represented by wheat, corn and barley, which cause the death of many livestock and humans [8]. The isolates are F. musarumand, F.poae, and F. equeiseti are capable of producing T-2 toxins, but they are the main source of T-2 production by the presence of F. sporotrichioides [9]. The microscopic structures produced by the fungus Fusarium and the phenotypic and cultivar characteristics depended in diagnosing this fungus, as the microscopic characteristics include the size and shape of the conidia, the length to width ratio, the number of septums, the composition of the terminal cell, the shape of the basal cell, the presence or absence of squamous spores, and the color and appearance of the colonies [10-11].
Material and Methods
Sample collection
Processed cereals included canned corn, dry corn, flour corn, and fresh corn, with a number of 20 samples. All of specimens were obtained in Baghdad's local markets (IRAQ). Each test was mixed to 1 kg, and then it was crushed by using this sieved mixture to produce a 250g sample (kept at – 20 °C), and finally 50 gm, samples are given in Table 1.
Preparation of the standard solution
T-2 toxin standard stock solution in acetonitrile was prepared at a concentration of 500 mg/ml. From the average solution, survey solutions of 25 mg/ml and 50 mg/mL in methanol/water (70:30, v/v) were generated. All stock solutions were sealed and kept at a temperature of 20 when it is not in use.
HPLC analysis
This work makes the use of extract cleaning/up, specimen preparation, and HPLC procedure [12]. Residue was diluted in 1.0 mL of (70:30 v/v) methanol/water, and then it was filtered by millipore filter. Ranges of points have been consumed to quantify.
Requirements of procedure
With only a wavelength of 209 nm, rate of 0.8 ml minute, a diagram movement of 0.25 cm/min, and a heating rate of environment, the solvent system is 70:30 V/V methanol/water. After getting degassed with a Waters In-Line degasser, the mobile phase was screened with a Millex HV Millipore (0.45 mm) filter. T-2 toxin standard curves (tR 10.0 min) were linear between 62.5 and 500 ng concentration ranges.
Phenotypic characteristics
The most important phenotypic characteristics that were adopted in the diagnosis of Fusarium spp. are the color and texture of the colony. To check colony color for fungal isolate, one cm diameter disc was transferred from the edge of a fresh colony of a pure fungal isolate to the middle of a petri dish containing medium at 2°C for five days. The dishes were kept in the dark at 25°C by using PDA media. At the end of incubation period, the fungal cultures were examined, especially the color of the farm, its edges, the texture of the farm, and the development of its pigment according to the method of [13].
Statistical Analysis
To demonstrate the effect of the differential factors on the test parameters, the Statistical Analysis System-SAS (2018) software was utilized. In this study, the LSD least significant difference test was performed to make a major comparison between means [14].
Table 1: Represents the samples under study
|
Type of Cereal |
Code |
Sample |
Number |
|
Canned Corn |
R1 |
Cereal |
1 |
|
R2 |
Cereal |
2 |
|
|
R3 |
Cereal |
3 |
|
|
R4 |
Cereal |
4 |
|
|
R5 |
Cereal |
5 |
|
|
Dried Corn |
R6 |
Cereal |
6 |
|
R7 |
Cereal |
7 |
|
|
R8 |
Cereal |
8 |
|
|
R9 |
Cereal |
9 |
|
|
R10 |
Cereal |
10 |
|
|
Flour Corn |
R11 |
Cereal |
11 |
|
R12 |
Cereal |
12 |
|
|
R13 |
Cereal |
13 |
|
|
R14 |
Cereal |
14 |
|
|
R15 |
Cereal |
15 |
|
|
Fresh Corn |
R16 |
Cereal |
16 |
|
R17 |
Cereal |
17 |
|
|
R18 |
Cereal |
18 |
|
|
R19 |
Cereal |
19 |
|
|
R20 |
Cereal |
20 |
Results and Discussion
HPLC was used for all samples, which included T2 toxin- infected samples (≥1 ppm). Toxin detection limits for HPLC are (0.25ppm, 25 ng/spot, 50 ng/spot, 1 ppm). Variation coefficient was 3.5 %. HPLC detected T-2 toxin in 8 out of 20 cereal types (between 0.38 ppm and 1.9 ppm). T2 levels in cereal products were (1.9 ppm, and 1.6 ppm), respectively, as measured by HPLC (Table 2). One of the most often used procedures for identifying TCTCs is HPLC, due to the little absorption strength, it was necessary to practice short wavelengths approximately 201 nm, TCTC analysis by HPLC with UV detection is difficult [15].
In addition, a wavelength of 209 nm was utilized in this experiment [16]. The ratio was 91 % (S.D. 2.22, m 4) when cereals with a known quantity with added T-2 toxin have been used (1 ppm). The Result for 1 ppm T-2 toxin, as the same as the results of [17, 18] are 93 % (SD 5.3, n 6), barley and wheat are 94 % (SD 15.6, n 6). Figure 1 displays a liquid chromatogram of a T-2 toxin standard as well as a highly contaminated flour corn extract.
T2 toxin was identified in 40% of product samples. T-2 toxin-contaminated tests are infrequent (less than 10%), but high levels of T-2 toxin could be observed, including such 24 ppm in grain and 37.7 ppm in peanuts [19]. The T2 was identified at (0.01-0.2) ppm in (13 of 20) maize models from New Zealand [20]. In other study, 11 % of sample are noted from Nova Scotia (spring and winter wheat, 2-6 row, barley) exhibited measurable amounts of T-2 (from 0.16, 0.31 ppm) [17]. T-2 toxin was found in 6.7 % of grain products (30 samples) collected in Italy, with a maximum concentration by 4.2 ppm in corn flour test [21].
T-2 toxin generation in Iran is lower than the authorized standards, according to a small number of researches on cereals [22]. In studies on 23 samples of cereal products from the Markets, the T-2 toxin contamination was below the criteria [23].
New findings demonstrate that T-2 toxin is commonly found in cereals in Europe, and that all newly detected F. langsethiae strains have been reported from Europe, T-2 toxin production in the atypical strain F. langsethiae, which was discovered in prior research of preserved wheat, was further detected in these experiments [24].
The permissible T-2 toxin recovery percent has been indicated at the Commission of the European Communities (CEC) as 60-110 % for more than 0.25 g/gr, 60-120 % for less than 0.25 g/gr [25].
For the mycotoxins T-2 toxin, fumonisins B1, B2, mycotoxins instruction plays only in the latter from Italy [21]. Given the toxin's toxicity, a serious constraint in nutriments ingested via persons should stay established. Cereals, which are frequently exported, play an essential role in our food system and economy. As a result, foods must be monitored and examined during dispensation, all mycotoxin investigates across the perfect nutrition cable are critical for person condition [26].
Depending on the phenotypic characteristics of Fusarium spp., the colonies of these fungal species varied in the speed of their growth, the density of the produced mycelium, and their shapes and colors, as their colors ranged from white to pink, violet, yellow or orange and brown, and the strength of their colonies. This description is consistent with what was mentioned [13].
Table 2: HPLC analysis of T-2 toxin in processed cereal products
|
Processed cereal Specimen products |
T- 2 ( Positive/ Total ) |
T-2 rang / (ppm) |
Mean of T-2 (ppm) |
|
HPLC |
HPLC |
HPLC |
|
|
Canned corn |
0 / 2 |
-- |
-- |
|
Canned corn |
0 /1 |
-- |
-- |
|
Canned corn |
4 / 5 |
0.44-1.20 |
0.80 |
|
Canned corn |
1/1 |
0.38 |
0.38 |
|
Canned corn |
0/6 |
-- |
-- |
|
Dried corn |
0 / 2 |
-- |
-- |
|
Dried corn |
0 / 1 |
-- |
-- |
|
Dried corn |
0/2 |
-- |
-- |
|
Dried corn |
1/1 |
1.10 |
1.10 |
|
Dried corn |
0/3 |
0.88 |
0.88 |
|
Corn flour |
0/2 |
0.45 |
0.45 |
|
Corn flour |
2/5 |
1.4-1.9 |
1.8 |
|
Corn flour |
2/2 |
-- |
-- |
|
Corn flour |
0/1 |
-- |
-- |
|
Corn flour |
0/1 |
-- |
-- |
|
Fresh corn |
1/4 |
1.60 |
-- |
|
Fresh corn |
1/1 |
-- |
-- |
|
Fresh corn |
0/2 |
-- |
-- |
|
Fresh corn |
1/1 |
-- |
-- |
|
Fresh corn |
0/6 |
-- |
-- |
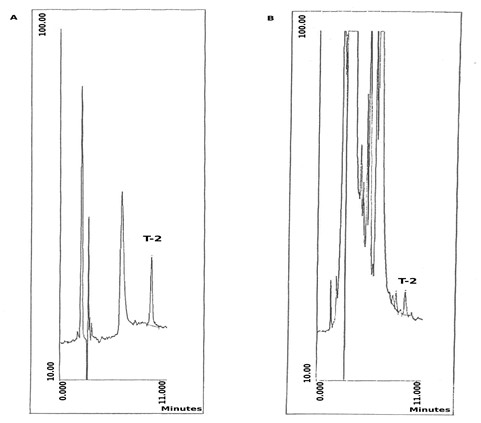
Figure 1: (A) T-2 toxin standard liquid chromatogram (125 ng), (b) flour corn extract contaminated with T-2 toxin (1.1 ppm)
Conclusion
This work introduces an HPLC-based T-2 toxin assay procedure. This strategy can be presented as a novel technique that is distinct from others seen in the literature. As a result, we recommend storing the grains at a higher temperature with minimal humidity.
Acknowledgment
The authors would like to thank all study participants of Market Research and Consumer Protection Center, University of Baghdad, Iraq prior to commencing this study.
Funding
This research did not receive any specific grant from fundig agencies in the public, commercial, or not-for-profit sectors.
Authors' contributions
All authors helped with data analysis, drafting, and revising the manuscript, and they all agreed to take responsibility for all areas of the manuscript.
Conflict of Interest
The authors indicated no conflicts of interest.
ORCID:
Sudad Jasim Mohammed
https://www.orcid.org/0000-0002-1750-0576
HOW TO CITE THIS ARTICLE
Sudad Jasim Mohammed. Detection of the mycotoxin T2 produced by Fusarium spp. in some local cereal products and studying its phenotypic characteristics in Baghdad City. J. Med. Chem. Sci., 2022, 5(7) 1208-1214
)