Document Type : Original Article
Authors
1 National University of Sciences and Technology, College of Pharmacy, Thi-Qar, Iraq
2 Department of Chemistry, College of Science, University of Thi-Qar, Iraq
3 Department of Pharmacy, Mazaya University College, Nasiriyah, Iraq
Abstract
In this work, the extraction of copper (II) by bis(3-chloro acetylacetone) ethylenediamine as a chelating reagent was studied by CPE using Triton X-100 as non-ionic surfactant and by solvent extraction using chloroform. Factors affecting extraction of copper (II) by both methods were studied such as equilibrium pH, effect of the ligand amounts, effect of equilibrium temperature, volume of solvent, and amount of non-ionic surfactant Triton X-100.
Graphical Abstract
 ... ', 'data/jmcs/coversheet/581651356421.jpg'))
Keywords
Introduction
One of the most effective separation procedures is solvent extraction, which is widely utilized for the separation and recovery of numerous heavy metal ions [1]. Solvent extraction is a technique that is widely used in both industrial and laboratory settings. It encompasses a wide range of procedures, including liquid-liquid extraction (LLE), liquid-solid extraction (LSE), supercritical fluid extraction (SFE), and others. LLE is a liquid extraction technique that uses a liquid extracting media to extract liquids, liquid samples, or samples in solution [2-4]. The solvent extraction process, often known as liquid-liquid extraction in metallurgical operations, can be stated very easily by equation 1:
![]()
Where M represents the metal and E represents the extractant.
However, due to the use of expensive, dangerous and combustible organic solvents, this technology has some limitations and downsides. Micellar systems were widely used in the extraction and preconcentration of metal ions and organic compounds as an alternative to organic solvents, and they quickly became one of the most popular preconcentration steps for improving sensitivity in metal and organic analysis, as well as an important practical application in the use of surfactants in analytical chemistry [5]. "Cloud point extraction" (abbreviated as CPE) or "micelle-mediated extraction" (abbreviated as MME) were the names given to this technology. The earliest application of CPE dates back to the works of Watanabe and co-workers [6], who proposed the use of CPE by applying non-ionic surfactants as an alternate solvent for the extraction of metal ions [5,7]. When heated to its critical cloud point temperature (CPT), CPE is based on the separation of hydrophobic analyte, i.e. inorganic and/or organic analyte, between two phases generated from micellar of non-ionic surfactant solution, i.e. the temperature above which an aqueous solution of water-soluble nonionic surfactant becomes turbid owing to the decrease in the solubility of the surfactant in water. Surfactant-rich phase (SRP) with a tiny volume containing the analyte is confined by organized micelles, and surfactant-poor phase (SPP) or bulk aqueous phase with a few surfactant molecules at critical micelle concentration (CMC) [8]. CPE, being a unique separation method, has several advantages over standard solvent extraction. This procedure employs water and lowers the consumption and exposure to a solvent. Furthermore, CPE might contribute to greater recovery efficiency and a high concentration factor because the presence of the surfactant can reduce analyte losses [9–12]. Cloud point extraction has been used to extract, preconcentrate, separate, and/or purify numerous inorganic species and organic molecules from various aqueous matrices [13–18]. CPE extractions of heavy metal ions have been accomplished utilizing a variety of chelating ligands, including dithizone [19,20], 1-(2-thiazolyl azo)-2-naphthol (TAN) [21–23], and 8-hydroxyquinoline (HQ) [24]. Another family of potent chelating ligands is the Schiff bases. Indeed, they are well known as extractants with high structural stiffness and stability, and they are also used in the selective solvent extraction of various metal cations [25–29]. They have, however, only been used sparingly in cloud point extraction [30–32]. The extraction of the cloud point of copper from the sulfate medium has also been compared with the solvent extraction of copper from the sulfate medium.
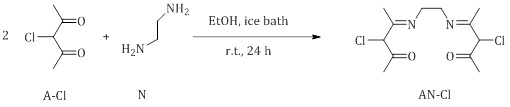
Figure 1: The structures of the chelating ligand and surfactant that were utilized
Materials and Methods
Solvents and Reagent
All analytical grade reagents acquired from multiple companies were used without further purification. The standard, reagents, and samples were all diluted with deionized water. Sigma (Sigma Ultra,>99.6 percent) provided the nonionic surfactant (TritonX-100), whose chemical structure is C8H17C6H4 (OC2H4)n with n equal to 9-10 and an average molecular weight of 625 gm/mol. Sigma Aldrich provided hydrated copper (II) sulfate (99.0 percent), NaOH (99.0 %), and HCl (37 %). The Cu(II) stock solution at 100 μg.mL-1 was made by dissolving 0.039 gm of CuSO4.5H2O of deionized water in a 100 ml volumetric flask, followed by finishing to mark with deionized water and thoroughly mixing.
Synthesis of bis(3-chloro acetylacetone) ethylenediamine (AN-Cl)
Ethylenediamine (0.6 mL, 0.5315 g, 1eq) in 2 ml ethanol was added gradually to 3-chloro acetyl acetone (2 mL, 2.38 g, 2eq) in 2 ml ethanol placed in ice bath. The resulting mixture was stirred at room temperature for 24 h. The reaction mixture was left to dry under air atmosphere and then under vacuum at room temperature. The produced precipitate was washed with distilled water yield (1.86 g, 71.8 %) [33].
Synthesis of Cu (AN-Cl)2
Over a period of 10 minutes, AN-Cl (0.6 g, 1 eq) AN-Cl in methanol 4 mL was added gradually with stirring to copper (II) acetate in 6 mL of distilled water – methanol mixture (1:1); the reaction mixture was heated at 60 °C for 2 hours, followed by cooling in an ice bath. The resultant violet precipitate was collected by filtration, washed with cold distilled water and then dried in an oven (100 °C) yield (0.7 g, 96.5 %).
Figure 2: Synthesis of CuAN-Cl
Experimental Procedure for Solvent extraction
10 ml of 100 μg.mL-1 Cu(SO4)2.5H2O dissolved in deionized water (aqueous phase) was mixed separately with 10 mL of (0.0136, 0.0204, 0.0273, 0.0341, 0.0409, 0.0477) mmol of AN-Cl dissolved in chloroform (organic phase) . The mixture was shaken for 5 minutes and then left in water bath at 70 °C for 20 minutes. The upper aqueous phase was used to determine the copper(II) using a UV-Vis spectroscopy.
Experimental Procedure for CPE
An aliquot of 10 mL of 100 μg.mL-1 Cu(SO4)2.5H2O, 1mL of (0.0136, 0.0204, 0.0273, 0.0341, 0.0409, 0.0477) mmol AN-Cl dissolved in chloroform separately and 1 mL of 1% Triton X-100 were mixed. The mixture was shaken for 5 min and left to stand in a thermostated bath 70 °C for 20 min to form a cloud point layer (CPL). The separation of the phases was achieved by centrifugation at 3500 rpm for 5 min, where the surfactant-rich phase became highly viscous and settled down at the bottom of the tube making the aqueous phase be easily discarded by decantation. The remaining quantity of Cu(II) in aqueous solution was determined after extraction by subtracting the amount of Cu(II) measured in the surfactant-rich phase from the original quantity, then the distribution ratio (D) and extraction efficiency (E%) were computed using the following equations 2 and 3:
D = [Mn+]˳/[[Mn+]eq 2
E = (D/l +D)×100 3
Where [Mn+]o: metal ion concentration transferred to micelle phase and [Mn+]aq: metal ion concentration that remained (residual) in aqueous phase.
The CPE and Solvent extraction parameters
The effects of various experimental parameters on CPE and Solvent extraction efficiency were investigated. The extraction efficiency of the CPE is dependent on two aspects: The development of a complex with sufficient hydrophobicity and the formation of micelles to achieve the required separation and preconcentration. As a result, this study focused on the effects of ligand concentration, pH, the reaction time, equilibration temperature, and Triton X-100 concentration.
Effect of ligand amount
Different amounts of reagent were used in this study (0.0136, 0.0204, 0.0273, 0.0341, 0.0409, 0.0477) mmol. In CPE 1 mL of the reagent at a certain concentration was added to 10 ml of 100 μg.mL-1 Cu (II) and 1mL of 1% Triton X-100), while in solvent extraction, 10 mL of the reagent solution was used instead . Then, these contents were subjected to the experimental procedures for CPE and solvent extraction under study. The results are represented in Figures 5 and 6 and Tables 1 and 2.
Effect of the heating time
The effect of different heating times was examined on the extraction. 10 , 15, 20, 25, 30 and 35 min. In CPE 10 mL of 100 µg.mL-1 Cu(II), 1 ml of 0.0341 mmol AN-Cl and 1 mL of 1% Triton X-100 are mixed. In solvent extraction, 10 mL of 0.0341 mmol AN-Cl was used instead in absence of triton. The contents were then subjected to experimental procedures of CPE and solvent extraction. The results are represented in Figures 7 and 8 and Tables 3 and 4.
Effect of equilibrium temperature
A series of individual experiments were conducted to study the effect of equilibrium temperature on the extraction of10 ml of 100 μgmL-1 of Cu(II) with 1 mL of 0.0341 mmol of AN-Cl and 1 mL of 1% Triton X-100 in CPE. As for the method of solvent extraction, 10 mLof 0.0341 mmol of AN-Cl was used instead in absence of triton. The temperature for CPE to obtain varied between 70 °C to 90 °C optimum temperature. As for the extraction with solvents, the temperatures ranged between 50 °C to 70 °C. The results are shown in Figures 9 and 10 and Tables 5 and 6.
Effect of PH
A series of individual experiments were conducted to study the effect of pH on the extraction of10 mL of 100 μgmL-1 of Cu(II) with 1 mL of 0.0341 mmol of AN-Cl and 1 mL of 1% Triton X- 100 in CPE. As for the method of solvent extraction, 10 mL of 0.0341 mmol of AN-Cl was used instead in absence of triton. The pH was adjusted from 4 to 9 in a search of optimum values using 0.5 M hydrochloric acid and 0.5 M sodium hydroxide. The content of each experiment was subjected to the general procedures for CPE and solvent extraction. The related results are shown in Figures 11 and 12 and Tables 7 and 8.
Effect of triton X-100 amount and volume of solvent
Different volumes of 1% Triton X-100 ranging from 0.5 - 3mL were used, added to 10 mL of 100 μg.ml-1 of Cu (II) ion solution and 1 mL of 0.0341 mmol of reagent solution (AN-Cl) in CPE. For the extraction with solvents, different volumes of solvent were used, ranging from (5-30 mL) using 0.0341 mmol of reagent solution (AN-Cl) that are added to 10 mL of 100 μg.mL-1 of Cu (II) ion solution. The results are shown in Figures 13 and 13 and Tables 9 and 10.
Results and Discussion
UV-Vis Spectroscopy
The visible spectra of 5 mM Cu (AN-Cl)2 complex shown in Figure 3, demonstrate two distinct absorption peaks, the first at wavelength 405 nm due to π-π* [34] and the second peak at 543 nm due to interior intramolecular charge transfer n-π*[35], which belongs to the C=C and C= N groups.
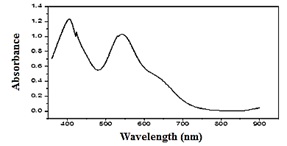
Figure 3: Visible spectrum of 5mM Cu (AN-Cl)2
Calibration curve of determination copper ion
The absorbances of 10-100 μg.mL-1Cu (AN-Cl)2 solutions were recorded at 405 nm to afford the calibration curve as depicted in Figure 4. The Cu(II) ion residual in the aqueous layers within extraction experiments was determined from the linear equation of the calibration curve A(=Y) =0.0365 C(=X) -0.0011. The Cu (II) concentration transferred to the organic layer was calculated from subtracting aqueous Cu (II) amount from the original Cu(II) quantity.
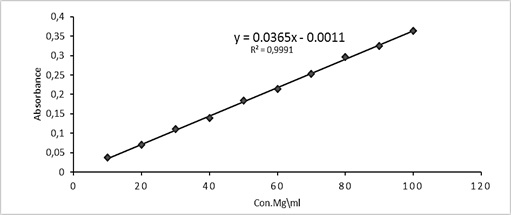
Figure 4: Calibration Curve for determination of copper (II) ion
Procedure for optimizing CPE and solvent extraction
Classic optimization was used to investigate the impacts of numerous experimental conditions on CPE efficiency (one-variable-at-a-time). We observed the effect of one component at a time on an experimental response using this method. While only one component is altered, the others remain constant. Nonetheless, classical optimization almost always leads to an improvement in the analytical method. As a result, this study focused on the impacts weight of ligand, pH, time, equilibration temperature, and Triton X-100 concentration. As for the extraction of solvents, to obtain the best results, some chemical determinants were studied, such as the concentration of the element, the amount of ligand, the acidity function, the shaking time, the volume of the solvent, and the temperature to reach the ideal conditions for extraction.
Effect of reagent (AN-Cl) amount
The effect of reagent AN-Cl concentration was tested at CPE by using a 10 mL solution containing 100 µg.mL-1 Cu(II), 1 mL of 1 % Triton X-100, and different amounts of 0.0136, 0.0204, 0.0273, 0.0341, 0.0409, 0.0477 mmol of AN-Cl, followed by the CPE process. Effect of ligand amount on extraction and distribution ratio in CPE was examined. As for solvent extraction, the effect of the amount of AN-Cl was investigated by taking 10 mL solution containing 100 µg.mL-1 Cu (II) and varying amounts of 0.0136, 0.0204, 0.0273, 0.0341, 0.0409, 0.0477 mmol of AN-Cl, following the solvent extraction procedure. Figures 5 and 6 and Tables 1 and 2 show that 0.0341 mmol was the ideal amount for complex formation and extraction into micelles rich phase layer, which manifests as greater absorbance and distribution ratio D. Because the amount of reagent was insufficient for extraction, any amount of AN-Cl less or more than 0.0341 mmol did not result in effective extraction. As a result, the amount of AN-Cl 0.0341 mmol was chosen as the optimum because it offers a high distribution ratio (D) and very stable ion-pair complex formation extractable into the surfactant. The distribution ratio (D) is derived from the remaining quantity of Cu(II) as CuSO4.5H2O and the amount of transferred Cu(II) as CuSO4.5H2O to form an ion-pair complex in the surfactant. At lower and larger than 0.0341 mmol, an unstable ion-pair complex was formed which led to depressing the extraction into surfactant, and because the complexation reaction was not sufficient to reach an ideal thermodynamic equilibrium for complex formation, the rate of dissociation became more than the rate of association [36].
Table 1: Effect of ligand amount on extraction and distribution ratio in CPE
|
CPE |
|||
|
D = |
1 + D |
E%= × 100 |
E= × 100 |
|
5.808464283 |
6.808464283 |
85.3124 |
85.3124 |
|
9.164357663 |
10.164357663 |
90.1617 |
90.1617 |
|
17.70837387 |
18.70837387 |
94.6548 |
94.6548 |
|
16.37287399 |
17.37287399 |
94.2439 |
94.2439 |
|
15.96899764 |
16.96899764 |
94.1069 |
94.1069 |
|
15.96899764 |
16.96899764 |
94.1069 |
94.1069 |

Figure 5: Effect of ligand amount on CPE
Table 2: Effect of ligand amount on extraction and distribution ratio in solvent extraction
|
Solvent Extraction |
|||
|
D = |
1 + D |
E%= × 100 |
E= × 100 |
|
2.348322658 |
3.348322658 |
70.1343 |
70.1343 |
|
3.006153452 |
4.006153452 |
75.0384 |
75.0384 |
|
4.191299382 |
5.191299382 |
80.737 |
80.737 |
|
4.09707377 |
5.09707377 |
80.3809 |
80.3809 |
|
3.660983374 |
4.660983374 |
78.5453 |
78.5453 |
|
3.381237787 |
4.381237787 |
77.1754 |
77.1754 |
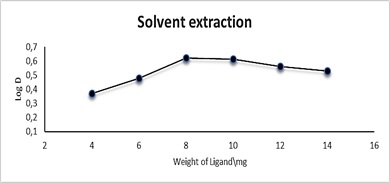
Figure 6: Effect of ligand amount in solvent extraction
Effect of the heating Time
The influence of heating time on extraction is a key component in the CPE process for achieving easy phase separation and the most efficient preconcentration. The effect of time on the extraction of Cu(II) as CuSO4.5H2O in the range of 10-35 min was examined by using a 10 mL aqueous solution containing 100 µg.mL-1 Cu+2,1 ml of 0.0341 mmol AN-Cl and 1 mL of 1% Triton X- 100, following the usual Procedure for CPE. The results are shown in Figure 7 and Table 3. It was found that the maximum time of heating is at 25 minutes and that after this value, poor quantitative extraction occurs, most likely due to the thermal instability of the complex. As a result of the heating time of 25 minutes, a very stable ion-pair complex extractable into surfactant was formed in CPE. When heating duration is less than optimal, no consideration is made for complete dehydration, which may result in an increase in micelle diffusion and finally a reduction in extraction capabilities. At the longer than optimal, the effect was also visible in lowering extraction efficiency due to increased diffusion [37].
Table 3: Effect of heating time on CPE
|
CPE |
|||
|
D = |
1 + D |
E%= × 100 |
E= × 100 |
|
15.15065329 |
16.15065329 |
93.8083 |
93.8083 |
|
16.04826363 |
17.04826363 |
94.1343 |
94.1343 |
|
17.15046737 |
18.15046737 |
94.4905 |
94.4905 |
|
17.70837387 |
18.70837387 |
94.6548 |
94.6548 |
|
14.72599034 |
15.72599034 |
93.6411 |
93.6411 |
|
13.59427904 |
14.59427904 |
93.148 |
93.148 |
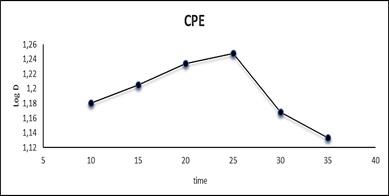
Figure 7: Effect of heating time in CPE
For solvent extraction, the effect of time on the extraction of Cu(II) as CuSO4.5H2O in the range of 10-35 min was investigated by taking 10 mL aqueous solution containing 100 μg.mL-1 Cu+2,10 mL of 0.0341 mmol AN Cl, following the general procedure for solvent extraction. The results are shown in Figure 8 and Table 4. It was shown that the maximum time of heating was observed at 25 minutes, followed by poor quantitative extraction, probably due to thermal instability of the complex. It was found that the heating time at 25 minutes helped to reach the state of equilibrium, leading to the formation of the ion-pair complex, which could control the free energy values for the transfer of ions from the aqueous phase to the organic and their ionic interconnection, where initially the rate of the forward reaction increases in equilibrium with the rate of the back reaction after 25 minutes [38,39].
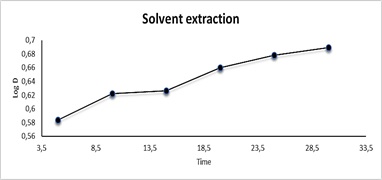
Figure 8: Effect of heating time in solvent extraction
Table 4: Effect of heating time on solvent extraction
|
Solvent extraction |
|||
|
D = |
1 + D |
E%= × 100 |
E= × 100 |
|
3.660983374 |
4.660983374 |
78.5453 |
78.5453 |
|
3.672897196 |
4.672897196 |
78.6 |
78.6 |
|
3.965317259 |
4.965317259 |
79.8603 |
79.8603 |
|
4.191299382 |
5.191299382 |
80.737 |
80.737 |
|
4.125707988 |
5.125707988 |
80.4905 |
80.4905 |
|
4.068757698 |
5.068757698 |
80.2713 |
80.2713 |
Effect of Equilibrium Temperature
The influence of the equilibrium temperature was investigated in CPE by using a 10 mL aqueous phase containing 100 μg.mL-1 Cu (II) as CuSO4.5H2O and maintaining other parameters at optimal conditions. Following the normal CPE method, the temperature was changed from 70°C to 90°C during 25 minutes. Because of the large number of micelles formed, an excellent phase separation occurred at 70°C, resulting in the total transference of the hydrophobic complex into the surfactant-rich phase, which maximizes sensitivity as shown in Figure 9 and table 5. The phase separation decreases at higher temperatures than ideal due to the complex's thermal decomposition [37].
Table 5: Effect of equilibrium temperature on CPE
|
CPE |
|||
|
D = |
1 + D |
E%= × 100 |
E= × 100 |
|
17.70837387 |
18.70837387 |
94.6548 |
94.6548 |
|
16.37287399 |
17.37287399 |
94.2439 |
94.2439 |
|
15.43412381 |
16.43412381 |
93.9151 |
93.9151 |
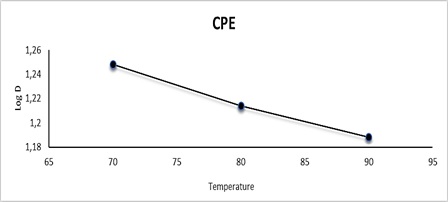
Figure 9: Effect of equilibrium temperature on CPE
In case of solvent extraction, the influence of the equilibrium temperature was investigated using a 10 mL aqueous phase containing 100 μg.mL-1 Cu (II) as CuSO4.5H2O and other parameters were kept at optimal levels. Following the solvent extraction method, the temperature was changed from 50°C to 70°C during 25 minutes. As shown in Figure 10 and Table 6, the results depict that the extraction rate increases with increasing temperature. This means that the interaction between the copper ion and the ligand is an endothermic reaction, hence an increase in the formation of the extracted complex with increasing temperature [40].
Table 6: Effect of equilibrium temperature on solvent extraction
|
Solvent extraction |
|||
|
D = |
1 + D |
E%= × 100 |
E= × 100 |
|
3.672897196 |
4.672897196 |
78.6 |
78.6 |
|
3.938442317 |
4.938442317 |
79.7507 |
79.7507 |
|
4.191299382 |
5.191299382 |
80.737 |
80.737 |
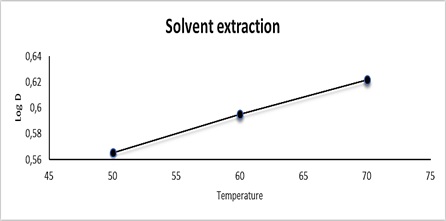
Figure 10: Effect of equilibrium temperature on solvent extraction
Effect of PH
The effect of pH was tested at CPE by using a 10 mL solution containing 100 µg.mL-1 Cu(II), 1 mL of Triton X-100, and 1ml 0.0341 mmol of reagent AN-Cl, followed by the CPE process. Effect of pH on extraction and distribution ratio in CPE was examined. As for solvent extraction, the effect of pH was investigated by taking 10 mL solution containing100 µg.mL-1 Cu(II) and 10mL of 0.0341 mmol of reagent AN-Cl, following the solvent extraction procedure. In both methods, the pH was changed with different pH to obtain the best and most efficient pH for extraction. The pH varied from 4 to 9 in a search of optimum values using 0.5M hydrochloric acid and 0.5 M sodium hydroxide in both of CPE and solvent extraction. The results are shown in Figures 11 and 12 and Tables 7 and 8. The optimal pH value was found to be 6 for Cu(II) with AN-Cl [41]. The most straightforward explanation for these data is that the ligand is highly protonated at low pH, rendering nonbonding electron pairs unavailable and hence decreasing the ability to form complexes with metal cations. When the pH is raised above the optimal level, the precipitation of copper (II) ion becomes more important, lowering the concentration of the complex.
Table 7: Effect of pH on CPE
|
CPE |
|||
|
D = |
1 + D |
E%= × 100 |
E= × 100 |
|
4.675658802 |
5.675658802 |
82.3809 |
82.3809 |
|
7.18203389 |
8.18203389 |
87.7781 |
87.7781 |
|
17.70837387 |
18.70837387 |
94.6548 |
94.6548 |
|
13.14187125 |
14.14187125 |
92.9288 |
92.9288 |
|
13.03311816 |
14.03311816 |
92.874 |
92.874 |
|
11.36873678 |
12.36873678 |
91.9151 |
91.9151 |
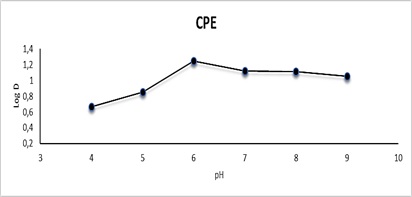
Figure 11: Effect of pH on CPE
Table 8: Effect of pH on solvent extraction
|
Solvent extraction |
|||
|
D = |
1 + D |
E%= × 100 |
E= × 100 |
|
2.701455412 |
3.701455412 |
72.9836 |
72.9836 |
|
3.055117152 |
4.055117152 |
75.3398 |
75.3398 |
|
4.191299382 |
5.191299382 |
80.737 |
80.737 |
|
3.360300337 |
4.360300337 |
77.0658 |
77.0658 |
|
3.109898691 |
4.109898691 |
75.6685 |
75.6685 |
|
2.941259469 |
3.941259469 |
74.6274 |
74.6274 |
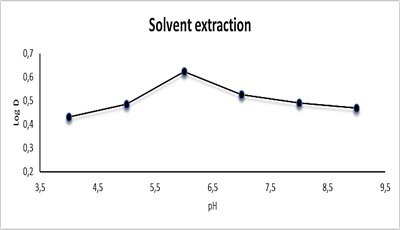
Figure 12: Effect of pH on solvent extraction
Effect of Triton X-100: The amount and volume of solvent
A successful cloud point extraction technique should optimize extraction efficiency by reducing the phase volume ratio, which improves the concentrating capability. The effect of Triton X-100 concentration was studied between 0.5-3 mL of 1 % in 10 ml aqueous solution containing 100 µg.mL-1 Cu (II) and 1mL of 0.0341 mmol reagent and subjected to typical CPE technique. Figure 13 and Table 9 show the results. Among the various surfactants employed for this study, Triton X-100 was chosen for the surfactant-rich phase due to its high extraction efficiency, acceptable cloud-point temperature, and high viscosity of the surfactant-rich phase, which aided in phase separation. The results showed that the maximum extraction was obtained when 1 mL of 1 % Triton X-100 was used (Figure 14 and Table 9) and that the extraction then declined as the overall analyte volumes and surfactant phase viscosity increased, resulting in low sensitivity [37].
Table 9: Effect of Triton X-100 amount on CPE
|
CPE |
|||
|
D = |
1 + D |
E%= × 100 |
E= × 100 |
|
9.337092589 |
10.337092589 |
90.3261 |
90.3261 |
|
17.70837387 |
18.70837387 |
94.6548 |
94.6548 |
|
16.37287399 |
17.37287399 |
94.2439 |
94.2439 |
|
14.86269253 |
15.86269253 |
93.6959 |
93.6959 |
|
14.86269253 |
15.86269253 |
93.6959 |
93.6959 |
|
14.07658907 |
15.07658907 |
93.3672 |
93.3672 |
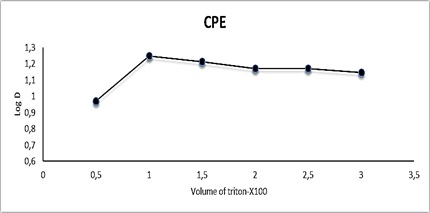
Figure 13: Effect of Triton X-100 on CPE
For solvent extraction, the effect of volume of solvent was studied between 5-30 ml of chloroform in 0.0341 mmol of reagent and 10 ml aqueous solution containing 100 µgml-1 Cu2+. Figure 14 and Table 10 show the results. Through the results, it was found that the extraction increases with the increase in the volume of the solvent, that is, the organic layer becomes more viscous, and the separation is carried out.
Table 10: Effect of solvent extraction on solvent extraction
|
Solvent extraction |
|||
|
D = |
1 + D |
E%= × 100 |
E= × 100 |
|
3.840224199 |
4.840224199 |
79.3398 |
79.3398 |
|
4.191299382 |
5.191299382 |
80.737 |
80.737 |
|
4.228484785 |
5.228484785 |
80.874 |
80.874 |
|
4.571682481 |
5.571682481 |
82.0521 |
82.0521 |
|
4.765283767 |
5.765283767 |
82.6548 |
82.6548 |
|
4.89567022 |
5.89567022 |
83.0384 |
83.0384 |
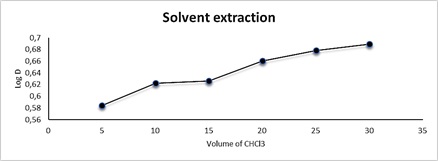
Figure 14: Effect of volume of solvent on solvent extraction
Conclusion: The composition of the complex was studied by two methods, namely solvent extraction, and cloud point extraction.It was found that extraction by cloud point to form the complex is better than the extraction of solvents.
Funding
This research did not receive any specific grant from fundig agencies in the public, commercial, or not-for-profit sectors.
Authors' contributions
All authors contributed toward data analysis, drafting and revising the paper and agreed to responsible for all the aspects of this work.
Conflict of Interest
We have no conflicts of interest to disclose.
ORCID:
Israa A. Jassem
https://www.orcid.org/0000-0003-4034-8665
HOW TO CITE THIS ARTICLE
Israa. A. Jassem, Wathiq. S. Abdul-Hassan, Ibrahim. A. Flafel, Sahir. A. Ali, Zahraa. M. Mahdi. Cloud Point and Solvent Extraction of Copper (II) by Bis(3-chloro acetylacetone) Ethylenediamine, J. Med. Chem. Sci., 2022, 5(6) 988-1000
- Rydberg J., Musikas C., Choppin G.R., Marcel Dekker, New York, 1992 [Google Scholar], [Publisher]
- Sinanoglu O., Chim. Acta, 1974, 33:279 [Crossref], [Google Scholar], [Publisher]
- Halicioglu T., Sinanoglu O., N. Y. Acad. Sci., 1974, 158:308 [Crossref], [Google Scholar], [Publisher]
- Moldoveanu S.C., David V., Sep. Sci., 2013, 36:2963 [Crossref], [Google Scholar], [Publisher]
- Yazdi A.S., Trends Anal. Chem., 2011, 30:918 [Crossref], [Google Scholar], [Publisher]
- Watanabe H., Tanaka H., Talanta, 1978, 25:585 [Crossref], [Google Scholar], [Publisher]
- Ojeda C.B., Rojas F.S., Acta, 2012, 177:1 [Crossref], [Google Scholar], [Publisher]
- Ghali A.A., Khammas Z.A., Kadhim K.H., Res. J. Pure Appl. Chem., 2014, 4:362 [Crossref], [Google Scholar], [Publisher]
- Sicilia D., Rubio S., Pe´rez-Bendito D., Maniasso N., Zagatto E.A.G., Chim. Acta, 1999, 392:29 [Crossref], [Google Scholar], [Publisher]
- Nascentes C.C., Aure´lio M., Arruda Z., Talanta, 2003, 61:759 [Crossref], [Google Scholar], [Publisher]
- Ohashi A., Tsugushi A., Imura H., Ohashi K., Sci., 2004, 20:1091 [Crossref], [Google Scholar], [Publisher]
- Afkami A., Bahram M., Gholami S.Z., Biochem., 2005, 336:295 [Crossref], [Google Scholar], [Publisher]
- Hinze W.L., Pramauro E., Rev. Anal. Chem., 1993, 24:133 [Crossref], [Google Scholar], [Publisher]
- Stalikas C.D., Trends Anal. Chem., 2002, 21:343 [Crossref], [Google Scholar], [Publisher]
- Hadj Youcef M., Benabdallah T., Ilikti H., J. Anal. Sci. Spectrosc., 2006, 51:267 [Google Scholar].
- Tani H., Kamidate T., Watanabe H., J Chromatogr. A, 1997, 780:229 [Crossref], [Google Scholar], [Publisher]
- Li J.J., Chen B.H., Colloid. Interface Sci., 2003, 263:625 [Crossref], [Google Scholar], [Publisher]
- Materna K., Milosz I., Miesiac I., Cote G., Szymanowski J., Sci. Technol., 2001, 35:2341 [Crossref], [Google Scholar], [Publisher]
- Manzoori J.L., Karim-Nezhad G., Chim. Acta, 2004, 521:173 [Crossref], [Google Scholar], [Publisher]
- Garrido M., Di-Nezio M.S., Lista A.G., Palomeque M., Fernadez-Band B.S., Chim. Acta, 2004, 502:173 [Crossref], [Google Scholar], [Publisher]
- Teo K.C., Chen J., Analyst, 2001, 126:534 [Crossref], [Google Scholar], [Publisher]
- Saitoh T., Kimura Y., Kamidata T., Watanabe H., Haragichi K., Sci., 1989, 5:577 [Crossref], [Google Scholar], [Publisher]
- Chen J., Teo K.C., Chim. Acta, 2001, 434:325 [Crossref], [Google Scholar], [Publisher]
- Shimerani F., Abkenar S.D., Jamali M.R., Indian J. Chem. Sect. (A), 2005, 44:1211 [Google Scholar], [Publisher]
- Spinu C., Kriza A., Acta Chim. Slov., 2000, 47:179 [Google Scholar], [Publisher]
- Benabdallah T., Al-Taiar H.A., Reffas H., Afr. J. Chem., 2004, 57:33 [Google Scholar], [Publisher]
- Ohashi Y., Chem. Soc. Jpn, 1997, 70:1319 [Crossref], [Google Scholar], [Publisher]
- Cimerman Z., Galic N., Bosner B., Chim. Acta, 1997, 343:145 [Crossref], [Google Scholar], [Publisher]
- Youcef M.H., Barkat D., Benabdallah T., Saudi Chem. Soc., 2006, 10:15 [Google Scholar], [Publisher]
- Shemirani F., Abkenar S.D., Mirroshandel A.A., Niasari M.S., Kozania R.R.,. Sci., 2003, 19:1453 [Crossref], [Google Scholar], [Publisher]
- Shemirani F., Jamali M.R., Kozani R.R., Salavati-Niasari M., Sci. Technol., 2006, 41:3065 [Crossref], [Google Scholar], [Publisher]
- Baghban N., Shabani A.M.H., Dadfarnia S., Jafari A.A., Braz. Chem. Soc., 2009, 20:832 [Google Scholar], [Publisher]
- Chen H., Jia L., Yao J., Hu J., Chen K., Chen Z., Li H., Phys. Org. Chem., 2015, 28:570 [Crossref], [Google Scholar], [Publisher]
- Hezaveh S.M., Khanmohammadi H., Zendehdel M., Acta A: Mol. Biomol. Spectrosc., 2018, 199:21 [Crossref], [Google Scholar], [Publisher]
- AL-Adilee K.J., Abedalrazaq K.A., Al- Hamdiny Z.M., Asian J. Chem., 2013, 25:10475 [Google Scholar]
- Ghaedi M., Shokrollahi A., Niknam K., Soylak M., Sci. Technol., 2009, 44:773 [Crossref], [Google Scholar], [Publisher]
- Khammas Z.A.A., jawwad S.K., Ali I.R., J. Sci. Front. Res. Chem., 2013, 13:9 [Google Scholar], [Publisher]
- Ghaedi M., Shokrollahi A., Ahmadi F., Rajabi H.R., Soylak M., Hazard. Mater., 2008, 150:533 [Crossref], [Google Scholar], [Publisher]
- Ghaedi, Ahmadi F., Soylak M., J. Hazard. Mater., 2007, 147:226 [Crossref], [Google Scholar], [Publisher]
- Citak D., Tuzen M., Food Chem. Toxicol., 2010, 48:1399 [Crossref], [Google Scholar], [Publisher]
- Mahmoud W.A., Ali A.M., Kareem T.A., Baghdad Sci. J., 2015, 12:96 [Crossref], [Google Scholar], [Publisher]
)